Bollinger Bands Strategy with Intraday Intensity IndexFor Educational Purposes. Results can differ on different markets and can fail at any time. Profit is not guaranteed.
This only works in a few markets and in certain situations. Changing the settings can give better or worse results for other markets.
This is a mean reversion strategy based on Bollinger Bands and the Intraday Intensity Index (a volume indicator). John Bollinger mentions that the Intraday Intensity Index can be used with Bollinger Bands and is one of the top indicators he recommends in his book. It seems he prefers it over the other volume indicators that he compares to for some reason. III looks a lot like Chaikin Money Flow but without the denominator in that calculation. On the default settings of the BBs, the III helps give off better entry signals. John Bollinger however is vague on how to use the BBs and it's hard to say if one should enter when it is below/above the bands or when the price crosses them. I find that with many indicators and strategies it's best to wait for a confirmation of some sort, in this case by waiting for some crossover of a band. Like most mean reversion strategies, the exit is very loose if using BBs alone. Usually the plan to exit is when the price finally reverts back to the mean or in this case the middle band. This can potentially lead to huge drawdowns and/or losses. Mean reversion strategies can have high win/loss ratios but can still end up unprofitable because of the huge losses that can occur. These drawdowns/losses that mean reversion strategies suffer from can potentially eat away at a large chunk of all that was previously made or perhaps up to all of it in the worst cases, can occur weeks or perhaps up to months after being profitable trading such a strategy, and will take a while and several trades to make it all back or keep a profitable track record. It is important to have a stop loss, trailing stop, or some sort of stop plan with these types of strategies. For this one, in addition to exiting the trade when price reverts to the middle band, I included a time-based stop plan that exits with a gain or with a loss to avoid potentially large losses, and to exit after only a few periods after taking the trade if in profit instead of waiting for the price to revert back to the mean.
Search in scripts for "stop loss"
AltS Swing [Backtester]
PLEASE READ THIS DESCRIPTION TO SAVE TIME AND UNDERSTAND WHAT THIS INDICATOR DOES
This is the backtesting version for this script
In this back tested version I have shown it to be used on regular candles with realistic calculations in regards to positions sizes, slippage, fees and more
Kind Regards
This is a official version of AltSignals Long/Short Reverse Indicator
Description:
This indicator uses various indicators in combination with each other, some of the key ones to mention is Hulls, EMA , MA. Along with that it uses EMA crossovers to get the precise entries and exits.
The recommended time frames with this indictor are shorter ones, for example 5m,10m,15m work well, along with that I have found that some of the more unique time frames also work well such as 20m,45m,2hr and so on.
This indicator is not super advanced but it's still very powerful, with only 130 lines of code.
This indicator works on every chart, time, and candle type but you must play with the settings to find what is best, the same setting will not work on every pair etc.
With AltSignals Swing Indicator it trades one way, that means it gives 3 pieces of information. BUY/TakeProfit/StopLoss.
Unlike most indicators which Buy and Sell both ways this one focuses on one direction of trading so please take into account when using this.
I have added in a reverse strategy which basically shows the opposite values of of the buy, so if you select the box in the settings and un-tick it, then it will show opposite directions so sells only.
This feature is very useful especially in general bear markets when buying is difficult.
I have also added in the option for no stop losses to be used, if you set the stop loss value = 100 then it will show no stop losses.
I suggest a stop loss somewhere in the region of 1-2-3%, please note that you can use decimal stop losses too so for example 0.1 or 0.5.
This indicator is NOT a once size fits all, every chart is different, time frame and candles also, so i would suggest spending some time going through and playing with the channel length settings, which will change the EMA numbers.
Using this along with the back script to find the ideal settings is the best way to use this script, once you have done that make sure to save those values somewhere.
Its important to remember that the Regular script and the back testing script values should be the same for them to match up on the chart, so the channel lengths, stop losses and so on values should be the same.
Side note
This is not financial advice.
We will continue making updates as time goes on.
If you would like to try this script for free please visit our website or message us on Tradingview live chat.
AltS Swing (INV)
PLEASE READ THIS DESCRIPTION TO SAVE TIME AND UNDERSTAND WHAT THIS INDICATOR DOES
This is a official version of AltSignals Long/Short Reverse Indicator
Description:
This indicator uses various indicators in combination with each other, some of the key ones to mention is Hulls, EMA , MA. Along with that it uses EMA crossovers to get the precise entries and exits.
The recommended time frames with this indictor are shorter ones, for example 5m,10m,15m work well, along with that I have found that some of the more unique time frames also work well such as 20m,45m,2hr and so on.
This indicator is not super advanced but it's still very powerful, with only 130 lines of code.
This indicator works on every chart, time, and candle type but you must play with the settings to find what is best, the same setting will not work on every pair etc.
With AltSignals Swing Indicator it trades one way, that means it gives 3 pieces of information. BUY/TakeProfit/StopLoss.
Unlike most indicators which Buy and Sell both ways this one focuses on one direction of trading so please take into account when using this.
I have added in a reverse strategy which basically shows the opposite values of of the buy, so if you select the box in the settings and un-tick it, then it will show opposite directions so sells only.
This feature is very useful especially in general bear markets when buying is difficult.
I have also added in the option for no stop losses to be used, if you set the stop loss value = 100 then it will show no stop losses.
I suggest a stop loss somewhere in the region of 1-2-3%, please note that you can use decimal stop losses too so for example 0.1 or 0.5.
This indicator is NOT a once size fits all, every chart is different, time frame and candles also, so i would suggest spending some time going through and playing with the channel length settings, which will change the EMA numbers.
Using this along with the back script to find the ideal settings is the best way to use this script, once you have done that make sure to save those values somewhere.
Its important to remember that the Regular script and the back testing script values should be the same for them to match up on the chart, so the channel lengths, stop losses and so on values should be the same.
Side note
This is not financial advice.
We will continue making updates as time goes on.
If you would like to try this script for free please visit our website or message us on Tradingview live chat.
AltS Swing
PLEASE READ THIS DESCRIPTION TO SAVE TIME AND UNDERSTAND WHAT THIS INDICATOR DOES
This is a official version of AltSignals Long/Short Reverse Indicator
Description:
This indicator uses various indicators in combination with each other, some of the key ones to mention is Hulls, EMA, MA. Along with that it uses EMA crossovers to get the precise entries and exits.
The recommended time frames with this indictor are shorter ones, for example 5m,10m,15m work well, along with that I have found that some of the more unique time frames also work well such as 20m,45m,2hr and so on.
This indicator is not super advanced but it's still very powerful, with only 130 lines of code.
With AltSignals Swing Indicator it trades one way, that means it gives 3 pieces of information. BUY/TakeProfit/StopLoss.
Unlike most indicators which Buy and Sell both ways this one focuses on one direction of trading so please take into account when using this.
I have added in a reverse strategy which basically shows the opposite values of of the buy, so if you select the box in the settings and un-tick it, then it will show opposite directions so sells only.
This feature is very useful especially in general bear markets when buying is difficult.
I have also added in the option for no stop losses to be used, if you set the stop loss value = 100 then it will show no stop losses.
I suggest a stop loss somewhere in the region of 1-2-3%, please note that you can use decimal stop losses too so for example 0.1 or 0.5.
This indicator is NOT a once size fits all, every chart is different, time frame and candles also, so i would suggest spending some time going through and playing with the channel length settings, which will change the EMA numbers.
Using this along with the back script to find the ideal settings is the best way to use this script, once you have done that make sure to save those values somewhere.
Its important to remember that the Regular script and the back testing script values should be the same for them to match up on the chart, so the channel lengths, stop losses and so on values should be the same.
Side note
This is not financial advice.
We will continue making updates as time goes on.
If you would like to try this script for free please visit our website or message us on Tradingview live chat.
MKAST V2 (monthly)PLEASE READ THE ENTIRE POST BEFORE PURCHASING & USING THE MKAST Algorithm. Saves you and me some time in emails and messages. :)
This is the NEW MONTHLY ACCESS Version of the MKAST
The MKAST Buy Sell Algorithm is a very specific strategy, cut down to its roots and made perfect for the volatile crypto market.
Many Algorithms focus only on one aspect, one side, one specific rule.
As you know, this is not how life, the market or anything else works.
MKAST combines many different aspects at the same time, scans multiple other Algorithms and comes to a conclusion based on over 1350 lines of code.
It is based on Divergences, Elliott Waves , Ichimoku , MACD , MACD Histogram, RSI , Stoch , CCI , Momentum, OBV, DIOSC, VWMACD, CMF and multiple EMAs.
Every single aspect is weighted into the decision before giving out an indication.
Most buy/sell Algorithms FAIL because they try to apply the same strategy to every single chart, which
are as individual as humans.
To conquer this problem, MKAST has a wide range of settings and variables which can be easily
modified.
To make it a true strategy, MKAST has as well settings for Take Profit Points, Multiple Entries and Stop
Losses. Everything with an Alert Feature of course.
I know from experience that many people take one Algorithm and are simply too LAZY to add multiple Algorithms to make a rational choice.
The result of that is that they lose money, by following blatantly only one Algorithm.
MKAST has additional 9 Indicators, perfect for the crypto market, which can be turned on and off.
Manual
MKAST Signals Settings
“Show Signals?” - On/Off to show the Buy/Sell Signals.
“Aggressiveness” - Increase to make the signals less aggressive and decrease to make them more aggressive.
“Show Custom Signals?” - On/Off to show custom MKAST Signals as chosen in the settings below.
“Custom Buy/Sell Aggressiveness” - Choose a custom Aggressiveness for each buy and sell signal individually.
“TJ-Index Requirement For Buy/Sell” - If the TJ-Index is below the given number, it will show the signal in grey, this also applies for normal signals. Buy 0 and Sell 15 shows all signals in their original colour again.
“Don’t show signals that don’t meet index requirement?” - Checked, it will completely not show signals which would be “grey” as in the explanation above.
“Change Backgroundcolour if index is at 15 or 0?” - Checked, changes the colour of the chart if the index is at 15 or 0 points
MKAST Panel Settings
“Show Info Panel?” - Shows Info Panel on the chart.
“Move Info Panel UP by %” - Moves Info Panel up/down.
“Move Info Panel Left/Right ” - Moves Info Panel Left/Right.
“Show BitMEX Panel?” - Shows BitMEX Panel on the chart.
“Move BitMEX Panel by % ” - Moves BitMEX Panel up/down.
“Move BitMEX Panel Left/Right” - Moves BitMEX Panel Left/Right. “Signal Source” - Choose source of candle open/close for Equity calculation.
“Leverage Used?” - Select the used Leverage for your strategy and Equity calculation.
“Fees Per Trade in % ” - Deducts these fees after each trade from Equity calculation.
“Round Current Profit Price?” - Rounds the number on the Panel. “Trading Periods ” - Choose a trading Period which will be used to calculate Period Equity.
“Show separations of each Trading Period?” - Show separations on the chart of each Trading Period.
The very new feature on Tradingview and obviously now as well on MKAST are Information Panels.
I have chosen to add an Info Panel and a BitMEX Price Panel into MKAST, to make live and even
backtesting easier.
With only one blink of an eye the user is able to see ALL relevant information, without having to go
through various ways of checking and using other tools.
The Info Panel:
The first row shows the current profit. This is calculated since the signal initiation and the current candle close. Followed by a single number, which represents the current TJ-Index, removing the need of having to add the actual TJ-Index Oscillator on the chart.
The second row shows the current position and its status. This was added on request of many users wanting to know if their position is “about to change” or not. The status shows the users if the position is “endangered” or “okay”.
Followed by the “backtesting tool” already included inside the Panel. No need for complex oscillators with a hard reading for backtesting. With this one and simple panel, you see the Period Equity for the period chosen previously in the settings. This calculates all profits made inside that period and re-sets when the period ends. Right next to it, the Total Equity calculating ALL profits since the beginning of the chart.
Right below, you see the information about the last long and short position which have been open. This helps with the evaluation and documentation of the last trade.
The BitMEX Panel:
A convenient panel which shows all BitMEX contracts and their LIVE prices. The need for opening each chart goes away, the quality and experience of trading increases.
MKAST custom Signals are one of the notorious possibilities for ADVANCED strategies with MKAST.
Users who requested these features and use them frequently are the ones, having already a very unique trading strategy and they use these very custom signals as confluence or for multiple entry trades.
These custom signals and their settings can be mostly ignored by the majority of traders who are using this Algorithm.
The idea behind the grey signals has its roots in the idea of the TJ-Index. The TJ-Index being 15 Algorithms and conditions possible showing a bullish or bearish interpretation. The index counts the Algorithms which are showing a bullish interpretation.
Like that we can make sure that signals are shown in the original colour, are only those who have an additional confluence with the TJ-Index, not letting the user buy, if at least the majority is not bullish , and not letting the user sell, if at least the majority is bearish .
The custom buy and sell aggressiveness lets the user customise the MKAST algorithm even more.
Either the users wants to see how signals are changing on a different (slightly lower or higher) aggressiveness, being able to expect a change on their own settings. OR seeing that some signals of the same sort are a little out of place and is able to move these to a different aggressiveness, increasing the profitability even more.
Needless to say, custom signals are NOT a part of the Info Panel.
MKAST Label & Trendline Settings
“Show Labels?” - On/Off to show Labels above each signal, with the percentage gain or loss, calculated from the last signal to the new signal.
“Show Trendlines?” - On/Off to show automatic Trendlines following Gainzy Lines.
“Lookback Length” - Choose a length that the automatic trendiness use for calculation. Comparable to Aggressiveness.
“Wicks//Bodies” - Change between trendiness connecting from wick to wick or from body to body.
“Black lines// Coloured lines” - Change between simply black lines or changing colour lines.
“Filter Trendlines?” - On/Off to show all trendiness or just resistance decreasing and support increasing ones.
“Limit Extensions Of The Lines?” - This value increases by how much the trendiness are being extended. 0 = endless extension, otherwise 100 = maximum custom extension.MKAST Strategy “Take Profit 1” - On/Off to show TP1 points.
“Take Profit After %” - Set the percentage after which TP1 is active.
“Take Profit 2 ” - On/Off to show TP2 points.
“Take Profit 2 After %” - Set the percentage after which TP1 is
active.
“Take Profit 3” - On/Off to show TP3 points.
“Take Profit 3 After %” - Set the percentage after which TP1 is active.
“Second Entry” - On/Off to show Second Entry points.
“Second Entry After %” - Set the percentage after which Second Entry is active.
“Third Entry” - On/Off to show Third Entry points.
“Third Entry After %” - Set the percentage after which Third Entry is active.
“Stop Loss” - On/Off to show Stop Loss points.
“Stop Loss After %” - Set the percentage after which Stop Loss is active.
MKAST Strategy
To make the life of the MKAST user even easier, I have added all adjustable Take Profit Points, Multiple entry points and Stop Loss points.
I have never seen a sustainable and reliable trading strategy without TPs, Multiple entry and especially without a stop loss. Everything in the usual and fully customisable MKAST style.
Simply choose how many Take Profit points you would like to have and choose the percentage after which you would like to see the Take Profit point appear on the chart and notify you to take profits.
Are you a Trader who likes Multiple Entries? Also no problem with MKAST. Select how many additional entries you would like to have and after how many percent you would like them to appear on the chart and remind you of adding to the position.
What would a Strategy be without a Stop Loss? Same settings apply here as on the TPs and MEs .
All of the settings are able to take fractions of a number as well. This enables users to even use all of the strategy settings for scalping or FX pairs, where high leverage and the smallest of moves are used for trading.
Needless to say, all of these settings work on RENKO and Heikin Ashi as well. These might need adjustment, since the calculation is different, yet there is nothing standing in the way of it anymore.
Crypto Modified Indicators
“Show Divergences?” - On/Off to show Divergences on the Chart based on the data of 10 different Algorithms.
“Show Oversold/bought?” - On/Off to change the colour of the chart in Oversold/bought conditions.
“Oversold/bought value?” - Choose a value for which the chart is Oversold/bought.
“Show Fibonacci Levels?” - On/Off to show automatic Fibonacci Levels.
“Fibonacci Lookback Lenght” - This value states how many candles from right now are taken into account to paint the Fibonacci Levels.
“Fibonacci Custom Period” - Choose a custom Timeframe that should be used to paint the Fibonacci Levels.
“2nd-7th Fibonacci Level” - Enter a value for the Fibonacci Levels you would like to use and see on the chart.
“Plot 1.618 Level?” - On/Off for the Fibonacci extension level.
Crypto Modified Indicators
“Show Bands?” - On/Off to show the TJ-Bands on the chart.
“Bands Length” - Choose a value for the TJ-Bands Lenght
“Show Show EMA 1-3?” - On/Off to show the EMAs 1-3 on the chart.
“EMA Lenght 1-3” - Choose a value for the first to third EMA Lenght
“Show Ichimoku? ” - On/Off to show Ichimoku on the chart.
“Show Tenkin?” - On/Off to show Tenkin on the chart. “Tenkin” - Set the lenght of the Tenkin.
“Show Kijun?” - On/Off to show Kijun on the chart.
“Kijun” - Set the lenght of the Kijun.
“Show Senkou?” - On/Off to show the Senkou on the chart. “Senkou” - Set the lenght of the Senkou.
“Displacement” - Set the value of the Displacement.
“Show Chikou Span?” - On/Off to show the Chikou Span on the chart.
Crypto Custom Indicators
In the picture above, you see the first pair of Crypto Custom Indicators. The oversold and overbought conditions are highlighted.
Bullish and Bearish divergences are also plotted on the chart.
This is personally my favourite combination of Indicators and MKAST settings. It shows nicely
everything one needs to know and makes it easier to decide wether to follow a signal or not.
We here as well a perfect example of the Automatic Fibonacci Lines (Lookback 50, Timeframe 1D).
It shows all significant levels, which we can see being respected.
Orange = 23.6%, Green = 38.2%, Red = 50%, Yellow = 61.8%, Blue = 78.6%, White = 0%;100%
In this picture above, we observe the perfect ensemble of MKAST and an EMA strategy, especially modified for crypto markets.
Here, as by default, we have the EMAs at 21, 90 and 200. These have shown to be very significant moving support and resistance points in the crypto market.
In this picture above, I lowered the timeframe to show the highly significant levels of the Ichimoku . It has not the “usual values”. These here have been modified for the volatile crypto market and set as default.
An incredibly powerful tool for anyone who is ready to step up their trading game. It is a huge part of the MKAST back end and the strategy behind it.
MKAST Custom Alerts
1
MKAST without any doubt has Custom Alerts for all Signals that it is painting on the chart.
One can even choose to receive custom notifications for Take Profit points, Multiple Entry points and
the Stop Loss points.
The signals appear on the chart DURING the candle, not at the end of the candle. Therefore, the
alerts do this as well. These appear during the candle.
Here we can see all of the possible Alerts that can be chosen to be displayed. In total it is 14 different custom alerts, based on what the trader is looking for and how he is trading.
Personally, I have 10-15 coins that I trade the most and for these I have custom notifications, mostly though only the MKAST Buy/Sell and Stop Loss Signals.
To activate Alerts for MKAST,
1) Go to the “ALERT” icon on the top tool bar of your Tradingview.
2) Select “CONDITION” as “—MKAST—“
3) Then choose ONE condition from the list of conditions.
4) On “OPTIONS” you can set how many times it appears, I have “Once per Bar”.
4.1) If you want to make sure that the signal is truly there and not just a condition for a second during the candle, choose “ONCE PER BAR CLOSE”.
5) “Expiration Time” sets the time until the alert expires. PRO users have no expiration for alerts.
6) “Alert Actions” give you a row of choices what happens and how you want to be notified.
7) “Message” is the message that you receive inside the notification.
Thank you, Kong
MKAST V2 (lifetime)PLEASE READ THE ENTIRE POST BEFORE PURCHASING & USING THE MKAST Algorithm. Saves you and me some time in emails and messages. :)
This is the NEW LIFETIME ACCESS Version of the MKAST
The MKAST Buy Sell Algorithm is a very specific strategy, cut down to its roots and made perfect for the volatile crypto market.
Many Algorithms focus only on one aspect, one side, one specific rule.
As you know, this is not how life, the market or anything else works.
MKAST combines many different aspects at the same time, scans multiple other Algorithms and comes to a conclusion based on over 1350 lines of code.
It is based on Divergences, Elliott Waves, Ichimoku, MACD, MACD Histogram, RSI, Stoch, CCI, Momentum, OBV, DIOSC, VWMACD, CMF and multiple EMAs.
Every single aspect is weighted into the decision before giving out an indication.
Most buy/sell Algorithms FAIL because they try to apply the same strategy to every single chart, which
are as individual as humans.
To conquer this problem, MKAST has a wide range of settings and variables which can be easily
modified.
To make it a true strategy, MKAST has as well settings for Take Profit Points, Multiple Entries and Stop
Losses. Everything with an Alert Feature of course.
I know from experience that many people take one Algorithm and are simply too LAZY to add multiple Algorithms to make a rational choice.
The result of that is that they lose money, by following blatantly only one Algorithm.
MKAST has additional 9 Indicators, perfect for the crypto market, which can be turned on and off.
Manual
MKAST Signals Settings
“Show Signals?” - On/Off to show the Buy/Sell Signals.
“Aggressiveness” - Increase to make the signals less aggressive and decrease to make them more aggressive.
“Show Custom Signals?” - On/Off to show custom MKAST Signals as chosen in the settings below.
“Custom Buy/Sell Aggressiveness” - Choose a custom Aggressiveness for each buy and sell signal individually.
“TJ-Index Requirement For Buy/Sell” - If the TJ-Index is below the given number, it will show the signal in grey, this also applies for normal signals. Buy 0 and Sell 15 shows all signals in their original colour again.
“Don’t show signals that don’t meet index requirement?” - Checked, it will completely not show signals which would be “grey” as in the explanation above.
“Change Backgroundcolour if index is at 15 or 0?” - Checked, changes the colour of the chart if the index is at 15 or 0 points
MKAST Panel Settings
“Show Info Panel?” - Shows Info Panel on the chart.
“Move Info Panel UP by %” - Moves Info Panel up/down.
“Move Info Panel Left/Right ” - Moves Info Panel Left/Right.
“Show BitMEX Panel?” - Shows BitMEX Panel on the chart.
“Move BitMEX Panel by % ” - Moves BitMEX Panel up/down.
“Move BitMEX Panel Left/Right” - Moves BitMEX Panel Left/Right. “Signal Source” - Choose source of candle open/close for Equity calculation.
“Leverage Used?” - Select the used Leverage for your strategy and Equity calculation.
“Fees Per Trade in % ” - Deducts these fees after each trade from Equity calculation.
“Round Current Profit Price?” - Rounds the number on the Panel. “Trading Periods ” - Choose a trading Period which will be used to calculate Period Equity.
“Show separations of each Trading Period?” - Show separations on the chart of each Trading Period.
The very new feature on Tradingview and obviously now as well on MKAST are Information Panels.
I have chosen to add an Info Panel and a BitMEX Price Panel into MKAST, to make live and even
backtesting easier.
With only one blink of an eye the user is able to see ALL relevant information, without having to go
through various ways of checking and using other tools.
The Info Panel:
The first row shows the current profit. This is calculated since the signal initiation and the current candle close. Followed by a single number, which represents the current TJ-Index, removing the need of having to add the actual TJ-Index Oscillator on the chart.
The second row shows the current position and its status. This was added on request of many users wanting to know if their position is “about to change” or not. The status shows the users if the position is “endangered” or “okay”.
Followed by the “backtesting tool” already included inside the Panel. No need for complex oscillators with a hard reading for backtesting. With this one and simple panel, you see the Period Equity for the period chosen previously in the settings. This calculates all profits made inside that period and re-sets when the period ends. Right next to it, the Total Equity calculating ALL profits since the beginning of the chart.
Right below, you see the information about the last long and short position which have been open. This helps with the evaluation and documentation of the last trade.
The BitMEX Panel:
A convenient panel which shows all BitMEX contracts and their LIVE prices. The need for opening each chart goes away, the quality and experience of trading increases.
MKAST custom Signals are one of the notorious possibilities for ADVANCED strategies with MKAST.
Users who requested these features and use them frequently are the ones, having already a very unique trading strategy and they use these very custom signals as confluence or for multiple entry trades.
These custom signals and their settings can be mostly ignored by the majority of traders who are using this Algorithm.
The idea behind the grey signals has its roots in the idea of the TJ-Index. The TJ-Index being 15 Algorithms and conditions possible showing a bullish or bearish interpretation. The index counts the Algorithms which are showing a bullish interpretation.
Like that we can make sure that signals are shown in the original colour, are only those who have an additional confluence with the TJ-Index, not letting the user buy, if at least the majority is not bullish, and not letting the user sell, if at least the majority is bearish.
The custom buy and sell aggressiveness lets the user customise the MKAST algorithm even more.
Either the users wants to see how signals are changing on a different (slightly lower or higher) aggressiveness, being able to expect a change on their own settings. OR seeing that some signals of the same sort are a little out of place and is able to move these to a different aggressiveness, increasing the profitability even more.
Needless to say, custom signals are NOT a part of the Info Panel.
MKAST Label & Trendline Settings
“Show Labels?” - On/Off to show Labels above each signal, with the percentage gain or loss, calculated from the last signal to the new signal.
“Show Trendlines?” - On/Off to show automatic Trendlines following Gainzy Lines.
“Lookback Length” - Choose a length that the automatic trendiness use for calculation. Comparable to Aggressiveness.
“Wicks//Bodies” - Change between trendiness connecting from wick to wick or from body to body.
“Black lines// Coloured lines” - Change between simply black lines or changing colour lines.
“Filter Trendlines?” - On/Off to show all trendiness or just resistance decreasing and support increasing ones.
“Limit Extensions Of The Lines?” - This value increases by how much the trendiness are being extended. 0 = endless extension, otherwise 100 = maximum custom extension.MKAST Strategy “Take Profit 1” - On/Off to show TP1 points.
“Take Profit After %” - Set the percentage after which TP1 is active.
“Take Profit 2 ” - On/Off to show TP2 points.
“Take Profit 2 After %” - Set the percentage after which TP1 is
active.
“Take Profit 3” - On/Off to show TP3 points.
“Take Profit 3 After %” - Set the percentage after which TP1 is active.
“Second Entry” - On/Off to show Second Entry points.
“Second Entry After %” - Set the percentage after which Second Entry is active.
“Third Entry” - On/Off to show Third Entry points.
“Third Entry After %” - Set the percentage after which Third Entry is active.
“Stop Loss” - On/Off to show Stop Loss points.
“Stop Loss After %” - Set the percentage after which Stop Loss is active.
MKAST Strategy
To make the life of the MKAST user even easier, I have added all adjustable Take Profit Points, Multiple entry points and Stop Loss points.
I have never seen a sustainable and reliable trading strategy without TPs, Multiple entry and especially without a stop loss. Everything in the usual and fully customisable MKAST style.
Simply choose how many Take Profit points you would like to have and choose the percentage after which you would like to see the Take Profit point appear on the chart and notify you to take profits.
Are you a Trader who likes Multiple Entries? Also no problem with MKAST. Select how many additional entries you would like to have and after how many percent you would like them to appear on the chart and remind you of adding to the position.
What would a Strategy be without a Stop Loss? Same settings apply here as on the TPs and MEs.
All of the settings are able to take fractions of a number as well. This enables users to even use all of the strategy settings for scalping or FX pairs, where high leverage and the smallest of moves are used for trading.
Needless to say, all of these settings work on RENKO and Heikin Ashi as well. These might need adjustment, since the calculation is different, yet there is nothing standing in the way of it anymore.
Crypto Modified Indicators
“Show Divergences?” - On/Off to show Divergences on the Chart based on the data of 10 different Algorithms.
“Show Oversold/bought?” - On/Off to change the colour of the chart in Oversold/bought conditions.
“Oversold/bought value?” - Choose a value for which the chart is Oversold/bought.
“Show Fibonacci Levels?” - On/Off to show automatic Fibonacci Levels.
“Fibonacci Lookback Lenght” - This value states how many candles from right now are taken into account to paint the Fibonacci Levels.
“Fibonacci Custom Period” - Choose a custom Timeframe that should be used to paint the Fibonacci Levels.
“2nd-7th Fibonacci Level” - Enter a value for the Fibonacci Levels you would like to use and see on the chart.
“Plot 1.618 Level?” - On/Off for the Fibonacci extension level.
Crypto Modified Indicators
“Show Bands?” - On/Off to show the TJ-Bands on the chart.
“Bands Length” - Choose a value for the TJ-Bands Lenght
“Show Show EMA 1-3?” - On/Off to show the EMAs 1-3 on the chart.
“EMA Lenght 1-3” - Choose a value for the first to third EMA Lenght
“Show Ichimoku? ” - On/Off to show Ichimoku on the chart.
“Show Tenkin?” - On/Off to show Tenkin on the chart. “Tenkin” - Set the lenght of the Tenkin.
“Show Kijun?” - On/Off to show Kijun on the chart.
“Kijun” - Set the lenght of the Kijun.
“Show Senkou?” - On/Off to show the Senkou on the chart. “Senkou” - Set the lenght of the Senkou.
“Displacement” - Set the value of the Displacement.
“Show Chikou Span?” - On/Off to show the Chikou Span on the chart.
Crypto Custom Indicators
In the picture above, you see the first pair of Crypto Custom Indicators. The oversold and overbought conditions are highlighted.
Bullish and Bearish divergences are also plotted on the chart.
This is personally my favourite combination of Indicators and MKAST settings. It shows nicely
everything one needs to know and makes it easier to decide wether to follow a signal or not.
We here as well a perfect example of the Automatic Fibonacci Lines (Lookback 50, Timeframe 1D).
It shows all significant levels, which we can see being respected.
Orange = 23.6%, Green = 38.2%, Red = 50%, Yellow = 61.8%, Blue = 78.6%, White = 0%;100%
In this picture above, we observe the perfect ensemble of MKAST and an EMA strategy, especially modified for crypto markets.
Here, as by default, we have the EMAs at 21, 90 and 200. These have shown to be very significant moving support and resistance points in the crypto market.
In this picture above, I lowered the timeframe to show the highly significant levels of the Ichimoku. It has not the “usual values”. These here have been modified for the volatile crypto market and set as default.
An incredibly powerful tool for anyone who is ready to step up their trading game. It is a huge part of the MKAST back end and the strategy behind it.
MKAST Custom Alerts
1
MKAST without any doubt has Custom Alerts for all Signals that it is painting on the chart.
One can even choose to receive custom notifications for Take Profit points, Multiple Entry points and
the Stop Loss points.
The signals appear on the chart DURING the candle, not at the end of the candle. Therefore, the
alerts do this as well. These appear during the candle.
Here we can see all of the possible Alerts that can be chosen to be displayed. In total it is 14 different custom alerts, based on what the trader is looking for and how he is trading.
Personally, I have 10-15 coins that I trade the most and for these I have custom notifications, mostly though only the MKAST Buy/Sell and Stop Loss Signals.
To activate Alerts for MKAST,
1) Go to the “ALERT” icon on the top tool bar of your Tradingview.
2) Select “CONDITION” as “—MKAST—“
3) Then choose ONE condition from the list of conditions.
4) On “OPTIONS” you can set how many times it appears, I have “Once per Bar”.
4.1) If you want to make sure that the signal is truly there and not just a condition for a second during the candle, choose “ONCE PER BAR CLOSE”.
5) “Expiration Time” sets the time until the alert expires. PRO users have no expiration for alerts.
6) “Alert Actions” give you a row of choices what happens and how you want to be notified.
7) “Message” is the message that you receive inside the notification.
Thank you, Kong
Full Range Trading Strategy with DCA - Crypto, Forex, Stocks
Introduction
This is a Pine 4 range trading strategy. It has a twin study with several alerts. The design intent is to produce a commercial grade signal generator that can be adapted to any symbol and interval. Ideally, the script is reliable enough to be the basis of an automated trading system web-hooked to a server with API access to crypto, forex and stock brokerages. The strategy can be run in three different modes: long, short and bidirectional.
As a range trading strategy, the behavior of the script is to buy on weakness and sell on strength. As such trade orders are placed in a counter direction to price pressure. What you will see on the chart is a short position on peaks and a long position on valleys. Just to be clear, the range as well as trends are merely illusions as the chart only receives prices. However, this script attempts to calculate pivot points from the price stream. Rising pivots are shorts and falling pivots are longs. I refer to pivots as a vertex in this script which adds structural components to the chart formation. When trading in “Ping Pong” mode long and short positions are intermingled continuously as long as there exists a detectable vertex. Unfortunately, this can work against your backtest profitability on long duration trends where prices continue in a single direction without pullback. I have designed various features in the script to compensate for this event. A well configured script should perform in a range bound market and minimize losses in a trend. I also have a trend following version of this script for those not interested in trading the range. Please be aware these are two types of traders. You should know who you are.
This script employs a DCA feature which enables users to experiment with loss recovery techniques. This is an advanced feature which can increase the order size on new trades in response to stopped out or winning streak trades. The script keeps track of debt incurred from losing trades. When the debt is recovered the order size returns to the base amount specified in the TV properties tab. The inputs for this feature include a limiter to prevent your account from depleting capital during runaway markets. This implementation of DCA does not use pyramid levels. Only the order size on subsequent new trades are affected. Pyramids on the other hand increase the size of open positions. If you are interested in seeing pyramids in action please see the trend version of this script which features both DCA and pyramids. While DCA is a popular feature in crypto trading, it can make you a “bag” holder if your not careful. In other markets, especially margin trading, you’ll need a well funded account and much trading experience to manage this feature safely.
Consecutive loss limit can be set to report a breach of the threshold value. Every stop hit beyond this limit will be reported on a version 4 label above the bar where the stop is hit. Use the location of the labels along with the summary report tally to improve the adaptability of system. Don’t simply fit the chart. A good trading system should adapt to ever changing market conditions. On the study version the consecutive loss limit can be used to halt live trading on the broker side (managed manually).
Design
This script uses twelve indicators on a single time frame. The original trading algorithms are a port from a much larger program on another trading platform. I’ve converted some of the statistical functions to use standard indicators available on TradingView. The setups make heavy use of the Hull Moving Average in conjunction with EMAs that form the Bill Williams Alligator as described in his book “New Trading Dimensions” Chapter 3. Lag between the Hull and the EMAs form the basis of the entry and exit points. The vertices are calculated using one of five featured indicators. Each indicator is actually a composite of calculations which produce a distinct mean. This mathematical distinction enables the script to be useful on various instruments which belong to entirely different markets. In other words, at least one of these indicators should be able generate pivots on an arbitrarily selected instrument. Try each one to find the best fit.
The entire script is around 1800 lines of Pine code which is the maximum incidental size given the TradingView limits: local scopes, run-time duration and compile time. I’ve been working on this script for nearly two years and have tested it on various instruments stocks, forex and crypto. It performs well on higher liquidity markets that have at least a year of historical data. Although the script can be implemented on any interval, it has been optimized for small time frames down to 5 minutes. The 10 minute BTC/USD produces around 500 trades in 2 ½ months. The 1 hour BTC/USD produces around 1300 trades in 1 ½ years. Originally, this script contained both range trading and trend following logic but had to be broken into separate scripts due to the aforementioned limitations.
Inputs to the script use cone centric measurements in effort to avoid exposing adjustments to the various internal indicators. The goal was to keep the inputs relevant to the actual trade entry and exit locations as opposed to a series of MA input values and the like. As a result the strategy exposes over 50 inputs grouped into long or short sections. Inputs are available for the usual minimum profit and stop-loss as well as safeguards, trade frequency, DCA, modes, presets, reports and lots of calibrations. The inputs are numerous, I’m aware. Unfortunately, at this time, TradingView does not offer any other method to get data in the script. The usual initialization files such as cnf, cfg, ini, json and xml files are currently unsupported.
Example configurations for various instruments along with a detailed PDF user manual is available.
Indicator Repainting And Anomalies
Indicator repainting is an industry wide problem which mainly occurs when you mix backtest data with real-time data. It doesn't matter which platform you use some form of this condition will manifest itself on your chart over time. The critical aspect being whether live trades on your broker’s account continue to match your TradingView study.
Tackling this repainting issue has been a major project goal of this script. Based on my experience with Pine, most of the problems stem from TradingView’s implementation of multiple interval access. Whereas most platform provide a separate bar series for each interval requested, the Pine language interleaves higher time frames with the primary chart interval. The problem is exacerbated by allowing a look-ahead parameter to the Security function. The goal of my repaint prevention is simply to ensure that my signal trading bias remains consistent between the strategy, study and broker. That being said this is what I’ve done address this issue in this script:
1. This script uses only 1 time frame. The chart interval.
2. Every entry and exit condition is evaluated on closed bars only.
3. No security functions are called to avoid a look-ahead possibility.
4. Every contributing factor specified in the TradingView wiki regarding this issue has been addressed.
5. I’ve run a 10 minute chart live for a week and compared it to the same chart periodically reloaded. The two charts were highly correlated with no instances of completely opposite real-time signals.
The study does indeed bring up the TV warning dialog. The only reason for this is because the script uses an EMA indicator which according to TradingView is due to “peculiarities of the algorithm”.
One issue that comes up when comparing the strategy with the study is that the strategy trades show on the chart one bar later than the study. This problem is due to the fact that “strategy.entry()” and “strategy_exit()” do not execute on the same bar called. The study, on the other hand, has no such limitation since there are no position routines.
Please be aware that the data source matters. Cryptocurrency has no central tick repository so each exchange supplies TradingView its feed. Even though it is the same symbol the quality of the data and subsequently the bars that are supplied to the chart varies with the exchange. This script will absolutely produce different results on different data feeds of the same symbol. Be sure to backtest this script on the same data you intend to receive alerts for. Any example settings I share with you will always have the exchange name used to generate the test results.
Usage
The following steps provide a very brief set of instructions that will get you started but will most certainly not produce the best backtest. A trading system that you are willing to risk your hard earned capital will require a well crafted configuration that involves time, expertise and clearly defined goals. As previously mentioned, I have several example configs that I use for my own trading that I can share with you along with a PDF which describes each input in detail. To get hands on experience in setting up your own symbol from scratch please follow the steps below.
The input dialog box contains over 50 inputs separated into five sections. Each section is identified as such with a makeshift separator input. There are three main areas that must to be configured: long side, short side and settings that apply to both. The rest of the inputs apply to DCA, reporting and calibrations. The following steps address these three main areas only. You will need to get your backtest in the black before moving on to the more advanced features.
Step 1. Setup the Base currency and order size in the properties tab.
Step 2. Select the calculation presets in the Instrument Type field.
Step 3. Select “No Trade” in the Trading Mode field.
Step 4. Select the Histogram indicator from Section 2. You will be experimenting with different ones so it doesn’t matter which one you try first.
Step 5. Turn on Show Markers in Section 2.
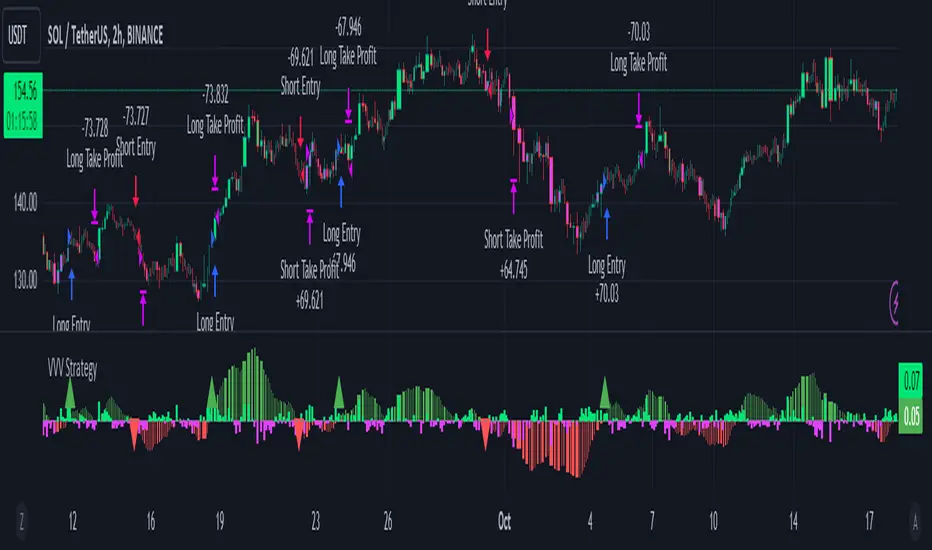
Step 6. Go to the chart and checkout where the markers show up. Blue is up and red is down. Long trades show up along the red markers and short trades on the blue.
Step 7. Make adjustments to “Base To Vertex” and “Vertex To Base” net change and roc in Section 3. Use these fields to move the markers to where you want trades to be.
Step 8. Try a different indicator from Section 2 and repeat Step 7 until you find the best match for this instrument on this interval. This step is complete when the Vertex settings and indicator combination produce the most favorable results.
Step 9. Go to Section 3 and enable “Apply Red Base To Base Margin”.
Step 10. Go to Section 4 and enable “Apply Blue Base To Base Margin”.
Step 11. Go to Section 2 and adjust “Minimum Base To Base Blue” and “Minimum Base To Base Red”. Observe the chart and note where the markers move relative to each other. Markers further apart will produce less trades but will reduce cutoffs in “Ping Pong” mode.
Step 12. Return to Section 3 and 4 and turn off “Base To Base Margin” which was enabled in steps 9 and 10.
Step 13. Turn off Show Markers in Section 2.
Step 14. Put in your Minimum Profit and Stop Loss in the first section. This is in pips or currency basis points (chart right side scale). Percentage is not currently supported. This is a fixed value minimum profit and stop loss. Also note that the profit is taken as a conditional exit on a market order not a fixed limit. The actual profit taken will almost always be greater than the amount specified. The stop loss, on the other hand, is indeed a hard number which is executed by the TradingView broker simulator when the threshold is breached. On the study version, the stop is executed at the close of the bar.
Step 15. Return to step 3 and select a Trading Mode (Long, Short, BiDir, Ping Pong). If you are planning to trade bidirectionally its best to configure long first then short. Combine them with “BiDir” or “Ping Pong” after setting up both sides of the trade individually. The difference between “BiDir” and “Ping Pong” is that “Ping Pong” uses position reversal and can cut off opposing trades less than the specified minimum profit. As a result “Ping Pong” mode produces the greatest number of trades.
Step 16. Take a look at the chart. Trades should be showing along the markers plotted earlier.
Step 17. Make adjustments to the Vertex fields in Section 2 until the TradingView performance report is showing a profit. This includes the “Minimum Base To Base” fields. If a profit cannot be achieved move on to Step 18.
Step 18. Improve the backtest profitability by adjusting the “Long Entry Net Change” and “Long Entry ROC” in Section 3.
Step 19. Improve the backtest profitability by adjusting the “Short Entry Net Change” and “Short Entry ROC” in Section 4.
Step 20. Improve the backtest profitability by adjusting the “Sparse Long Delta” in Section 3.
Step 21. Improve the backtest profitability by adjusting the “Chase Long Delta” in Section 3.
Step 22. Improve the backtest profitability by adjusting the “Long Adherence Delta” in Section 3. This field requires the “Adhere to Rising Trend” checkbox to be enabled.
Step 23. Try each checkbox in Section 3 and see if it improves the backtest profitability. The “Caution Lackluster Longs” checkbox only works when “Long Caution Mode” is enabled.
Step 24. Improve the backtest profitability by adjusting the “Sparse Short Delta” in Section 4.
Step 25. Improve the backtest profitability by adjusting the “Chase Short Delta” in Section 4.
Step 26. Improve the backtest profitability by adjusting the “Short Adherence Delta” in Section 4. This field requires the “Adhere to Falling Trend” checkbox to be enabled.
Step 27. Try each checkbox in Section 4 and see if it improves the backtest profitability. The “Caution Lackluster Shorts” checkbox only works when “Short Caution Mode” is enabled.
Step 28. Enable the reporting conditions in Section 5. Look for long runs of consecutive losses or high debt sequences. These are indications that your trading system cannot withstand sudden changes in market sentiment.
Step 29. Examine the chart and see that trades are being placed in accordance with your desired trading goals. This is an important step. If your desired model requires multiple trades per day then you should be seeing hundreds of trades on the chart. Alternatively, you may be looking to trade fewer steep peaks and deep valleys in which case you should see trades at major turning points. Don’t simply settle for what the backtest serves you. Work your configuration until the system aligns with your desired model. Try changing indicators and even intervals if you cannot reach your simulation goals. Generally speaking, the histogram and Candle indicators produce the most trades. The Macro indicator captures the tallest peaks and valleys.
Step 30. Apply the backtest settings to the study version and perform forward testing.
This script is open for beta testing. After successful beta test it will become a commercial application available by subscription only. I’ve invested quite a lot of time and effort into making this the best possible signal generator for all of the instruments I intend to trade. I certainly welcome any suggestions for improvements. Thank you all in advance.
JackBot Scalper v6Jackbot Scalper v6 Update
In Version 6, Jackbot has improved performance on higher time frames with close to 85% success rate on 1-hour times frames and 70% success rate on 15-minute time frames.
Who
I am Jack Donaghy, a crypto trader and wealth strategist at an international asset management firm. I have traded billions in assets for clients and have grown a portfolio of personal assets by nearly 2200% within the last 1.5 years from trading. I originally invested in cryptocurrencies in November of 2016 and have been catching waves ever since. This bot is for those interested in scalping methods.
What
Jackbot Pro Scalper is a scalping study for Bitcoin that operates on small timeframes. It has a 60-70% success rate and operates with the goal of maximizing gains while minimizing losses. This bot works well with leveraged strategies as it pursues both long and short positions. While I primarily use the bot on BitMex, I have seen good success on Bitfinex with various USDT pairs including VEN and ETH.
When
With v6, the best results have come from 13, 15, and 17-minute charts with incredible success found on the 1-hour charts.
How
The bot works by 1. Defining its entry point. 2. Defining a take profit 3. Defining a stop loss. The magic of the bot is that it will not close a trade at the take profit, if volume and price are increasing, it will hold the exit until another indicator determines a reversal of the trend. More than that would ruin the logic so you will just have to see for yourself.
To Trade
Large Spikes = Entries (Green = Long, Red = Short)
Small Spikes = Take Profit (Green = Long Exit, Red = Short Exit)
Medium Spikes = Stop Loss (Purple = Long SL, Yellow = Short SL)
Previous Results
Backtested, Jackbot v6 shows that with 1 Bitcoin (unleveraged) you can make about 12K in a 1.5 month period. My personal experience was trading a test amount of Bitcoin on a particularly good run at 25x leverage using 25% of a test portfolio It went from 0.015 Bitcoin to 0.091 within 10 days. See ibb.co (This test was from V5.4 which V6 has improved upon.)
Disclaimer: This strategy is by no means perfect and not every trade will be a winner. It is a tool in your belt, not a perfect 100% trader. Previously, results show with a 25x leveraged position, the losses are ~20% before it will cut off the trade, however, the gains can be 40%+ (As the bot continues to run in certain conditions, it will often pick up major moves and hold them for longer.) It can have bad runs and a slew of poor entries, especially in tight volatile ranges.
PLEASE NOTE: This strategy can struggle with chop following major moves, if you are manually entering, consider other market conditions before entry if the price is in a tight range.
Cost
Jackbot will be offered for 0.1 Bitcoin and will be limited to the first 100 people who apply.
JackBot Scalper V5.4 Who
I am Jack Donaghy, a crypto trader and wealth strategist at an international asset management firm. I have traded billions in assets for clients and have grown a portfolio of personal assets by nearly 2200% within the last 1.5 years from trading. I originally invested in cryptocurrencies in November of 2016 and been catching waves ever since. This bot is for those interested in scalping methods.
What
Jackbot Pro Scalper is scalping study for bitcoin that operates on small timeframes. It has a 60-70% success rate and operates with the goal of maximizing gains while minimizing losses. This bot works well with leveraged strategies as pursues both long and short positions. While I primarily use it on BitMex, I have seen good success on Bitfinex.
When
5-30 minute charts, longer time frames can work but have not been successful enough to warrant publishing. Best results have come from 13 and 17-minute timeframes.
How
The bot works by 1. Defining its entry point. 2. Defining a take profit 3. Defining a stop loss. The magic of the bot is that it will not close a trade at the take profit, if volume and price are increasing, it will hold the exit until another indicator determines a reversal of the trend. More than that would ruin the logic so you will just have to see for yourself.
To Trade
Large Spikes = Entries (Green = Long, Red = Short)
Small Spikes = Take Profit (Green = Long Exit, Red = Short Exit)
Medium Spikes = Stop Loss (Purple = Long SL, Yellow = Short SL)
Previous Results
Backtested, this bot shows that with 1 Bitcoin (unleveraged) you can make about 10K in a 1.5 month period. My personal experience was trading a test amount of bitcoin on a particularly good run at 25x leverage using 25% of a test portfolio It went from 0.015 bitcoin to 0.091 within 10 days. See ibb.co
Disclaimer: This strategy is by no means perfect and not every trade will be a winner. Previously results show with a 25x leveraged position, the losses are ~20% before it will cut off the trade, however, the gains can be 40%+ (As the bot continues to run in certain conditions, it will often pick up major moves and hold them for longer.) It can have bad runs and a slew of poor entries, especially in tight volatile ranges.
PLEASE NOTE: This strategy can struggle with chop following major moves, if you are manually entering, consider other market conditions before entry if the price is in a tight range.
Lot Size Calculator for FX(JPY Base)-By Jason v1.1 ロッド自動計算ツール🧭概要
このインジケーターは、日本円口座で取引するFXトレーダー専用に設計されたロットサイズ自動計算ツールです。
クロス円だけでなく、ドルストレート通貨ペア(EURUSD・GBPUSD・など)も自動換算に対応。
リアルなJPY換算ベースで、リスクとロットを正確に可視化します。
🎯 主な特徴
✅ JPY自動換算対応
ドルストレート・クロス円ペアを問わず、リアルタイムでJPYベースに換算。
✅ リスク/リワード自動計算
口座残高・ストップロス・リスク割合・固定損失額からロットサイズを即時算出。
✅ 証拠金維持率 / 実効レバレッジ表示
過剰エントリーを防ぎ、リスクを数値で管理。
✅ パネル表示を自由カスタマイズ
* 表示項目を個別にON/OFF可能
* 項目名(ラベル)を自分の言葉に変更可能
* パネル位置・文字サイズ・色・背景も自由設定
✅ 日本口座仕様に最適化
DMM、GMO、外為どっとコムなどJPY建て口座での取引計算に完全対応。
💡 推奨リスク管理ルール(プロトレーダー実践例)
プロ仕様のトレードは、「勝つこと」より「失わないこと」を最優先に行われます。
安定して利益を積み上げるトレーダーは、常に明確なリスク基準をもって行動します。
以下は、その代表的なリスク管理ルールです。
📉 連敗時のリスクコントロール(防御モード)
* 1トレードあたり口座残高の1%以下に抑える
* 連続2~3敗でリスクを半分(例:1%→0.5%)に下げる
* 1日の最大損失率を 3〜5%以内に制限(到達したらその日は終了)
* 「メンタルドローダウン」を避けるために連敗日翌日は休むことも多い
📘 目的:生き残ること。資金を守ることが最大の攻撃。
📈 連勝時のリスクコントロール(拡張モード)
* 2連勝以上の場合、**リスクを段階的に拡大(例:1%→1.5%)**
* ただし、最大でも3%以内
* リワードが積み上がっている時にのみ増加させる(利益分をリスクに再投資)
📘 目的:勝っている時にリスクを“複利的”に活かすが、ルール内にとどめる。
🧠 デイリーマネジメントルール(プロ基準)
1トレードリスク : 1〜2%以内
1日最大損失 :3〜5%以内
1週間最大損失 : 10%以内
リスクリワード比 :最低 1 : 2(理想は 1 : 3 以上)
勝率の目安 : 40〜50%でもRR管理で黒字維持可能
⚙️ このツールを使う理由
このロット計算機を使えば、
「感覚的なロット設定」から「数値的なリスク管理」へ進化できます。
✅ 過剰ロット防止
✅ 損失率の明確化
✅ 勝ち負けのバランス最適化
✅ 冷静なトレード継続が可能に
🧩 使い方
1️⃣ チャートにインジケーターを追加
2️⃣ 「口座残高」「リスク割合」「ストップロス(pips)」を設定
3️⃣ 「ロットサイズ」欄の数値が、**最適ロットサイズ**
4️⃣ リスク指標(証拠金維持率・実効レバレッジ)をチェック
⚠️ 免責事項
このインジケーターは教育目的の補助ツールです。
最終的な売買判断はご自身の責任で行ってください。
---
🧾 クレジット
Developed for Japanese Traders 🇯🇵
Optimized for FX Based Risk Control
Created by
💬 まとめ
資金を守ることは「守り」ではなく、次のチャンスに立ち続けるための最強の戦略です。
リスクを管理できる者だけが、長期的に勝ち続けることができます。
🧩 今後について
このインジケーターは、今後も使いやすさと精度を追求しながら改善を続けていきます。
もちろんです。以下は、あなたの日本語説明文を**自然でプロフェッショナルな英語**に翻訳したものです。
TradingViewのインジケーター説明欄にそのまま使えるトーン(ややフォーマル+分かりやすい)で整えています👇
---
🧭 Overview
This indicator is a **lot size auto-calculator** designed specifically for **FX traders using Japanese Yen (JPY) accounts**.
It automatically converts values not only for JPY crosses but also for **USD-based pairs (e.g., EURUSD, GBPUSD, etc.)**,
providing precise **risk and lot visualization in real JPY terms**.
🎯 Key Features
✅ **Automatic JPY Conversion**
Real-time JPY-based conversion for both USD and JPY pairs.
✅ **Risk / Reward Auto Calculation**
Instantly calculates the optimal lot size based on account balance, stop loss, and defined risk percentage or fixed loss.
✅ **Margin Maintenance Rate / Effective Leverage Display**
Prevents over-leveraging and allows you to monitor your risk numerically.
✅ **Fully Customizable Panel Display**
* Enable or disable each display item individually
* Rename labels freely to your preferred wording
* Adjust panel position, font size, colors, and background
✅ **Optimized for Japanese Brokerage Accounts**
Fully compatible with major JPY-based brokers such as **DMM, GMO, and Gaitame.com**.
💡 Recommended Risk Management Rules (Professional Trader Practices)
Professional trading prioritizes **“not losing” over “winning.”**
Consistent traders operate with a clear and disciplined risk framework.
Here are the most common examples of professional risk management rules:
📉 Loss Streak Risk Control (Defensive Mode)
* Keep risk per trade below **1% of account balance**
* After **2–3 consecutive losses**, reduce risk by half (e.g., 1% → 0.5%)
* Limit daily loss to **3–5%** — stop trading once reached
* Take a break after a losing streak to avoid **mental drawdown**
📘 **Objective:** Survival first. Protecting capital is the strongest form of offense.
📈 Win Streak Risk Control (Expansion Mode)
* After 2 consecutive wins, **gradually increase risk (e.g., 1% → 1.5%)**
* Never exceed **3% total risk per trade**
* Only scale up when trading with accumulated profit — reinvest from gains, not from capital
📘 **Objective:** Use profits to grow risk *compoundedly*, but always within defined limits.
🧠 Daily Risk Management (Professional Standards)
Risk per trade : 1–2% of account balance
Max daily loss : 3–5%
Max weekly loss :10%
Minimum R:R ratio : 1 : 2 (Ideal: 1 : 3 or higher)
Profitability baseline : 40–50% win rate can still stay profitable with proper R:R control
⚙️ Why Use This Tool?
This calculator helps you shift from **“emotional lot sizing” to “numerical risk control.”**
✅ Prevents over-lotting
✅ Clarifies risk exposure
✅ Balances wins and losses
✅ Enables calm, consistent execution
🧩 How to Use
1️⃣ Add the indicator to your chart
2️⃣ Set your **account balance**, **risk percentage**, and **stop loss (pips)**
3️⃣ The **“Lot Size”** value automatically displays the optimal lot size
4️⃣ Check risk indicators such as **Margin Maintenance** and **Effective Leverage**
⚠️ Disclaimer
This indicator is a **support tool for educational purposes only**.
All final trading decisions are the sole responsibility of the user.
🧾 Credits
Developed for **Japanese Traders 🇯🇵**
Optimized for **FX-Based Risk Control**
Created by ** **
💬 Summary
Protecting your capital isn’t a defensive move —
it’s the **strongest strategy to stay in the game and seize the next opportunity**.
Only those who manage risk properly can sustain consistent long-term success.
🧩 Future Updates
This indicator will continue to evolve with improvements in usability and accuracy.
Stay tuned for upcoming updates and refinements.
Candle Breakout StrategyShort description (one-liner)
Candle Breakout Strategy — identifies a user-specified candle (UTC time), draws its high/low range, then enters on breakouts with configurable stop-loss, take-profit (via Risk:Reward) and optional alerts.
Full description (ready-to-paste)
Candle Breakout Strategy
Version 1.0 — Strategy script (Pine v5)
Overview
The Candle Breakout Strategy automatically captures a single "range candle" at a user-specified UTC time, draws its high/low as a visible box and dashed level lines, and waits for a breakout. When price closes above the range high it enters a Long; when price closes below the range low it enters a Short. Stop-loss is placed at the opposite range boundary and take-profit is calculated with a user-configurable Risk:Reward multiplier. Alerts for entries can be enabled.
This strategy is intended for breakout style trading where a clearly defined intraday range is established at a fixed time. It is simple, transparent and easy to adapt to multiple symbols and timeframes.
How it works (step-by-step)
On every bar the script checks the current UTC time.
When the first bar that matches the configured Target Hour:Target Minute (UTC) appears, the script records that candle’s high and low. This defines the breakout range.
A box and dashed lines are drawn on the chart to display the range and extended to the right while the range is active.
The script then waits for price to close outside the box:
Close > Range High → Long entry
Close < Range Low → Short entry
When an entry triggers:
Stop-loss = opposite range boundary (range low for longs, range high for shorts).
Take-profit = entry ± (risk × Risk:Reward). Risk is computed as the distance between entry price and stop-loss.
After entry the range becomes inactive (waitingForBreakout = false) until the next configured target time.
Inputs / Parameters
Target Hour (UTC) — the hour (0–23) in UTC when the range candle is detected.
Target Minute — minute (0–59) of the target candle.
Risk:Reward Ratio — multiplier for computing take profit from risk (0.5–10). Example: 2 means TP = entry + 2×risk.
Enable Alerts — turn on/off entry alerts (string message sent once per bar when an entry occurs).
Show Last Box Only (internal behavior) — when enabled the previous box is deleted at the next range creation so only the most recent range is visible (default behavior in the script).
Visuals & On-chart Info
A semi-transparent blue box shows the recorded range and extends to the right while active.
Dashed horizontal lines mark the range high and low.
On-chart shapes: green triangle below bar for Long signals, red triangle above bar for Short signals.
An information table (top-right) displays:
Target Time (UTC)
Active Range (Yes / No)
Range High
Range Low
Risk:Reward
Alerts
If Enable Alerts is on, the script sends an alert with the following formats when an entry occurs:
Long alert:
🟢 LONG SIGNAL
Entry Price:
Stop Loss:
Take Profit:
Short alert:
🔴 SHORT SIGNAL
Entry Price:
Stop Loss:
Take Profit:
Use TradingView's alert dialog to create alerts based on the script — select the script’s alert condition or use the alert() messages.
Recommended usage & tips
Timeframe: This strategy works on any timeframe but the definition of "candle at target time" depends on the chart timeframe. For intraday breakout styles, use 1m — 60m charts depending on the session you want to capture.
Target Time: Choose a time that is meaningful for the instrument (e.g., market open, economic release, session overlap). All times are handled in UTC.
Position Sizing: The script’s example uses strategy.percent_of_equity with 100% default — change default_qty_value or strategy settings to suit your risk management.
Filtering: Consider combining this breakout with trend filters (EMA, ADX, etc.) to reduce false breakouts.
Backtesting: Always backtest over a sufficiently large and recent sample. Pay attention to slippage and commission settings in TradingView’s strategy tester.
Known behavior & limitations
The script registers the breakout on close outside the recorded range. If you prefer intrabar breakout rules (e.g., high/low breach without close), you must adjust the condition accordingly.
The recorded range is taken from a single candle at the exact configured UTC time. If there are missing bars or the chart timeframe doesn't align, the intended candle may differ — choose the target time and chart timeframe consistently.
Only a single active position is allowed at a time (the script checks strategy.position_size == 0 before entries).
Example setups
EURUSD (Forex): Target Time 07:00 UTC — captures London open range.
Nifty / Index: Target Time 09:15 UTC — captures local session open range.
Crypto: Target Time 00:00 UTC — captures daily reset candle for breakout.
Risk disclaimer
This script is educational and provided as-is. Past performance is not indicative of future results. Use proper risk management, test on historical data, and consider slippage and commissions. Do not trade real capital without sufficient testing.
Change log
v1.0 — Initial release: range capture, box and level drawing, long/short entry by close breakout, SL at opposite boundary, TP via Risk:Reward, alerts, info table.
If you want, I can also:
Provide a short README version (2–3 lines) for the TradingView “Short description” field.
Add a couple of suggested alert templates for the TradingView alert dialog (if you want alerts that include variable placeholders).
Convert the disclaimer into multiple language versions.
Renko Emulator Strategy # 🚀 Renko Emulator Strategy for Normal Candlestick Charts
Transform your trading with this advanced Renko-based strategy that works seamlessly on normal candlestick charts!
## ✨ What Makes This Special?
### 🎯 Smart Signal System
- **One Signal at a Time**: No confusing duplicate signals
- **Position State Tracking**: Always know your current position
- **Automatic Target Detection**: T1, T2, T3 calculated automatically
- **10 Comprehensive Alerts**: Never miss an opportunity
### 🔧 Technical Excellence
- **Renko Logic**: Filters market noise using brick formations
- **ATR-Based Sizing**: Adapts to market volatility
- **Multi-Indicator Confirmation**: EMA, RSI, MACD, Supertrend
- **Volume Validation**: Only high-probability setups
## 📊 How It Works
### Entry Signals
🟢 **LONG (BUY)**
- Reversal: Red bricks → First green brick
- Trend: 3+ consecutive green bricks
- With full technical confirmation
🔴 **SHORT (SELL)**
- Reversal: Green bricks → First red brick
- Trend: 3+ consecutive red bricks
- With full technical confirmation
### Position Management
📍 **Stop Loss**: Last opposite brick ± buffer
🎯 **Target 1**: 2× Brick size → Book 50%
🎯 **Target 2**: 3× Brick size → Book 30%
🎯 **Target 3**: 4× Brick size → Book 20%
### Exit Rules
⚠️ Opposite brick formation
⚠️ RSI extremes (>80 or <20)
⚠️ Manual exit as needed
## 🎨 Visual Features
### On Your Chart
- 📊 Renko brick overlays
- 🟢 Green triangles = BUY signals
- 🔴 Red triangles = SELL signals
- ⚪ Target hit markers (T1, T2, T3)
- 📈 Trend indicators overlay
- 🎨 Position background color
### Info Panel
Real-time dashboard showing:
- Current brick size & color
- Position status (LONG/SHORT/NONE)
- Consecutive brick count
- RSI level
- Trend direction
- Market conditions
## 🔔 Complete Alert System
**10 Alerts Available:**
✅ Long & Short Entry
✅ All 6 Target Hits (T1, T2, T3 each)
✅ Long & Short Exit
**Alert Messages Include:**
- Entry price & direction
- Profit booking instructions
- Risk management tips
- Next action guidance
## 💰 Best Instruments
### Highly Effective On:
- **Indian Markets**: Nifty 50, Bank Nifty
- **Stocks**: HDFC, Reliance, TCS, Infosys
- **Forex**: EUR/USD, GBP/USD, USD/JPY
- **Crypto**: BTC, ETH, major altcoins
- **Commodities**: Gold, Silver, Crude Oil
### Recommended Timeframes:
- **Day Trading**: 5-min, 15-min
- **Swing Trading**: 1-hour, 4-hour
- **Position Trading**: Daily
## ⚙️ Customizable Settings
### Brick Configuration
- ATR-based (automatic) or Fixed points
- Adjustable ATR period & multiplier
- Visual brick display on/off
### Indicator Parameters
- EMA length (default: 20)
- RSI period (default: 14)
- MACD settings (12, 26, 9)
- Supertrend (10, 3)
- Volume filter toggle
### Display Options
- Show/hide entry signals
- Show/hide target levels
- Show/hide info table
- Brick overlay transparency
## 📈 Usage Strategy
### For Beginners:
1. Add to chart with default settings
2. Wait for clear BUY/SELL arrows
3. Follow position management rules
4. Use recommended stop losses
5. Book profits at targets
### For Advanced Traders:
1. Optimize brick size per instrument
2. Fine-tune indicator parameters
3. Combine with your strategy
4. Backtest thoroughly
5. Scale position sizes
## ⚠️ Risk Management
### Built-in Protection:
- Maximum 2% risk per trade
- Clear stop loss levels
- Defined profit targets
- Position size calculator
- Daily loss limits
### Best Practices:
✅ Test on demo first
✅ Use proper position sizing
✅ Follow stop losses strictly
✅ Don't over-trade
✅ Maintain trading journal
## 🎓 What You Get
### Immediate Benefits:
- Clear entry/exit signals
- No analysis paralysis
- Reduced emotional trading
- Systematic approach
- Professional risk management
### Learning Opportunities:
- Understand Renko concepts
- Master position management
- Learn risk control
- Develop discipline
- Build consistent strategy
## 🐛 Troubleshooting
### No Signals?
- Check indicator settings
- Verify brick size not too large
- Ensure volume filter appropriate
- Try different timeframe
### Too Many Signals?
- Increase brick size
- Use higher timeframe
- Enable stricter filters
- Check signal filtering active
## 📊 Performance Notes
### Works Best In:
✅ Trending markets
✅ Clear directional moves
✅ Good liquidity
✅ Normal volatility
### Avoid Trading:
❌ Major news events
❌ Low volume periods
❌ Extreme volatility
❌ Choppy/sideways markets
## 🔄 Updates & Support
**Current Version**: 2.0
**Recent Updates:**
- ✅ Fixed duplicate signals
- ✅ Added position tracking
- ✅ Enhanced alert system
- ✅ Improved visual feedback
- ✅ Better target detection
**Future Plans:**
- Additional customization
- More alert options
- Advanced features
- Performance improvements
## 📜 Important Disclaimer
⚠️ **Please Read Carefully:**
This indicator is for **educational purposes only**. Trading involves substantial risk of loss. Past performance does not guarantee future results.
**You Must:**
- Use proper risk management
- Test strategies before live trading
- Never risk more than you can afford to lose
- Consult financial advisor if needed
- Understand your trading instrument
**The creator assumes no responsibility for trading losses incurred using this indicator.**
## 🙏 Credits
- Renko Concept: Traditional Japanese charting
- ATR Calculation: J. Welles Wilder
- Community Feedback: Beta testers & users
---
## 💬 Feedback Welcome!
If you find this helpful:
- ⭐ Like the indicator
- 💬 Share your feedback
- 🐛 Report bugs
- 💡 Suggest improvements
- 🔄 Share with traders
## 📞 Getting Started
1. **Add to Chart**: Click "Add to Chart"
2. **Configure Settings**: Adjust as needed
3. **Set Alerts**: Enable notifications
4. **Test First**: Use demo account
5. **Go Live**: Start small, scale up
---
**Happy Trading! 📈🚀**
**Trade Smart. Trade Safe. Trade Profitable.**
---
*Remember: Discipline + Risk Management + Good Strategy = Success*
*No indicator is perfect. Use as part of complete trading plan.*
Support and Resistance [Jamshid]📌 Support & Resistance
This indicator automatically identifies high-quality Support and Resistance zones using volume-weighted pivot levels. It visualizes price structure with adaptive volume boxes, breakout & retest signals, higher timeframe confirmation, and optional volume profile.
✅ Core Features
🔹 1. Smart Support & Resistance Zones (Volume-Based)
Detects pivot highs/lows with strong volume.
Boxes expand dynamically using ATR.
Zones display actual volume value.
Color intensity reflects volume strength.
🔹 2. Breakouts & Retests
“Break Sup / Break Res” labels on structure breaks.
Detects when old resistance becomes support (R→S).
Detects when old support becomes resistance (S→R).
Retest labels and diamond markers for holds.
🔹 3. Volume Profile (Optional)
Shows mini horizontal volume bars at each zone.
Separate bullish/bearish volume distribution.
Adjustable rows and lookback.
🔹 4. Higher Timeframe Confluence (Optional)
Check if current S/R aligns with HTF levels:
5m, 15m, 30m, 1H, 4H, Daily
Modes:
✅ Show All + HTF Labels
✅ Filter Only HTF Confirmed Levels
HTF confirmations shown directly on zone labels.
Tolerance setting for price matching.
🔹 5. Breaker Blocks (Failed S/R Reversal Zones)
Identifies bullish/bearish breaker zones.
Highlights breaker blocks on chart.
Optional labels and zone coloring.
🎯 Visual Alerts & Signals
✅ Breakouts (Support & Resistance)
✅ Retests (Hold without breakout)
✅ Role Reversal (R→S and S→R)
✅ Potential Bullish / Bearish Breakers
✅ Diamonds for hold/retest structure
✅ Labels with volume + timeframe confirmations
Every signal also has a built-in alertcondition so you can automate notifications.
⚙️ Customizable Settings
🟢 Main
Lookback period
Volume filter length
Box width multiplier
🎨 Visual
Show or hide labels, diamonds, retest labels
Label size
🟦 Breaker Blocks
Enable/disable breaker blocks
Show zones & labels
Custom colors
📊 Volume Profile
Enable/disable
Rows, lookback length
Bull/Bear color
⏳ Higher Timeframe Filtering
Turn HTF logic on/off
Select which timeframes to compare
Filter mode or label mode
Price matching tolerance (%)
✅ Why this indicator is unique
✔ Combines price structure + volume + HTF confluence
✔ Automatically adapts S/R strength using volume data
✔ Shows role reversal and breaker logic
✔ Smart visual alerts & automation support
✔ Highly customizable for any strategy or timeframe
💡 How to Use
Add the indicator to any chart or timeframe.
Look for high-volume S/R zones (darker colors = stronger).
Watch for:
Breakouts (trend continuation or reversal)
Retests (strong confirmations)
HTF confluence (higher probability)
Breaker blocks (failed level reversal)
Optionally enable alerts for automation or notifications.
******************************************************************
⚠️ Dangers of Trading
1️⃣ You can lose money very fast
Markets move quickly, and leverage makes losses even faster. Even experienced traders go through drawdowns.
2️⃣ Emotional decisions ruin accounts
Fear (selling too early) and greed (holding too long or overtrading) cause most losses. Trading is more psychological than technical.
3️⃣ Overconfidence after small wins
Many traders win at the beginning and believe they “mastered” the market, then take big risks and blow the account.
4️⃣ No system = gambling
If you trade without clear rules and risk management, you’re not trading—you’re gambling.
5️⃣ Market is not fair
Smart money, institutions, HFT algorithms, and stop-hunts exist. Retail traders are often the liquidity for bigger players.
6️⃣ News/Unexpected events
Unpredictable events (CPI, FOMC, war, tweets, etc.) can instantly move the market against your position.
✅ Advice for Safer & Smarter Trading
✅ 1. Protect your capital first
Your number one job is to survive.
Never risk more than 1–2% per trade.
✅ 2. Have a written trading plan
Define:
When to enter
When to exit
How much to risk
What conditions must be present
If your plan is not written, you don’t have a plan.
✅ 3. Use Stop Loss always
No stop loss = account suicide.
Even professional traders are wrong sometimes.
✅ 4. Focus on one strategy (mastery > trying everything)
Jumping from one strategy to another causes confusion. One good strategy with discipline beats five strategies with no consistency.
✅ 5. Trade with the trend and higher timeframe direction
Trading against HTF structure is fighting the market.
✅ 6. Control emotions like a machine
Biggest trader enemies:
Overtrading
Revenge trading
Fear of missing out (FOMO)
When emotions are strong → stop trading.
✅ 7. Be patient (best skill of a trader)
Sometimes the best trade is no trade.
Professional traders wait for high-probability setups.
✅ 8. Backtest and demo before using real money
If it doesn’t make money in backtesting or demo, it won’t magically work live.
✅ 9. Accept losses (they are part of the game)
Even the best traders lose. The key is small losses, big wins.
✅ 10. Keep learning forever
Market changes. What works today may not work tomorrow. Study price action, volume, psychology, risk management.
🧠 Final Truths:
✅ Trading is a business, not easy money
✅ Winning rate doesn’t matter—risk/reward matters
✅ Consistency > luck
✅ Discipline > knowledge
✅ Survival > profit
Strategy with Reference Lines📊 Strategy with Reference Lines
Description:
This strategy uses a contrarian approach based on the analysis of the previous candle to identify entry and exit points. The strategy draws horizontal reference lines at important levels of the previous candle and generates buy/sell signals based on the candle's direction.
Key Features:
🔹 Multi-Timeframe Analysis: Configurable for 1H, 2H, 3H, 4H, 6H, 12H, and 1D
🔹 Reference Lines: High, low, close, and midpoint (50%) of the previous candle
🔹 Visual Signals: Labels with prices and actions (BUY/SELL/TP)
🔹 Optional Trading: Enable/disable automatic order execution
🔹 Complete System: Automatic entry, Take Profit, and Stop Loss
🔹 Alerts: Notifications when a new candle is detected
Strategy Logic:
When the previous candle is POSITIVE:
Signal: 🔴 SELL at the previous candle's close
Take Profit: 🎯 Midpoint (50%) of the previous candle
Stop Loss: 🔴 High of the previous candle
When the previous candle is NEGATIVE:
Signal: 🟢 BUY at the previous candle's close
Take Profit: 🎯 Midpoint (50%) of the previous candle
Stop Loss: 🟢 Low of the previous candle
Visual Elements:
Green Line: High of the previous candle (when positive)
Red Line: Low of the previous candle (when negative)
Yellow Line: Close of the previous candle (always present)
Blue Line: Midpoint (50%) of the previous candle (always present)
Labels: Prices and actions with emojis for easy identification
Settings:
Timeframe: Default 4H (configurable)
Auto Trading: Disabled by default (safety)
Alerts: Include entry prices, TP, and SL
Recommended Usage:
✅ Visual Analysis: Use with trading disabled for analysis
✅ Backtesting: Enable trading to test historically
✅ Swing Trading: Ideal for 4H or higher timeframes
✅ Risk Management: Automatic SL and TP for protection
Risk Disclaimer:
This strategy is for educational and analysis purposes only. Always test in a simulation environment before using with real capital. Trading involves significant risks and may result in losses.
BOCS Channel Scalper Indicator - Mean Reversion Alert System# BOCS Channel Scalper Indicator - Mean Reversion Alert System
## WHAT THIS INDICATOR DOES:
This is a mean reversion trading indicator that identifies consolidation channels through volatility analysis and generates alert signals when price enters entry zones near channel boundaries. **This indicator version is designed for manual trading with comprehensive alert functionality.** Unlike automated strategies, this tool sends notifications (via popup, email, SMS, or webhook) when trading opportunities occur, allowing you to manually review and execute trades. The system assumes price will revert to the channel mean, identifying scalp opportunities as price reaches extremes and preparing to bounce back toward center.
## INDICATOR VS STRATEGY - KEY DISTINCTION:
**This is an INDICATOR with alerts, not an automated strategy.** It does not execute trades automatically. Instead, it:
- Displays visual signals on your chart when entry conditions are met
- Sends customizable alerts to your device/email when opportunities arise
- Shows TP/SL levels for reference but does not place orders
- Requires you to manually enter and exit positions based on signals
- Works with all TradingView subscription levels (alerts included on all plans)
**For automated trading with backtesting**, use the strategy version. For manual control with notifications, use this indicator version.
## ALERT CAPABILITIES:
This indicator includes four distinct alert conditions that can be configured independently:
**1. New Channel Formation Alert**
- Triggers when a fresh BOCS channel is identified
- Message: "New BOCS channel formed - potential scalp setup ready"
- Use this to prepare for upcoming trading opportunities
**2. Long Scalp Entry Alert**
- Fires when price touches the long entry zone
- Message includes current price, calculated TP, and SL levels
- Notification example: "LONG scalp signal at 24731.75 | TP: 24743.2 | SL: 24716.5"
**3. Short Scalp Entry Alert**
- Fires when price touches the short entry zone
- Message includes current price, calculated TP, and SL levels
- Notification example: "SHORT scalp signal at 24747.50 | TP: 24735.0 | SL: 24762.75"
**4. Any Entry Signal Alert**
- Combined alert for both long and short entries
- Use this if you want a single alert stream for all opportunities
- Message: "BOCS Scalp Entry: at "
**Setting Up Alerts:**
1. Add indicator to chart and configure settings
2. Click the Alert (⏰) button in TradingView toolbar
3. Select "BOCS Channel Scalper" from condition dropdown
4. Choose desired alert type (Long, Short, Any, or Channel Formation)
5. Set "Once Per Bar Close" to avoid false signals during bar formation
6. Configure delivery method (popup, email, webhook for automation platforms)
7. Save alert - it will fire automatically when conditions are met
**Alert Message Placeholders:**
Alerts use TradingView's dynamic placeholder system:
- {{ticker}} = Symbol name (e.g., NQ1!)
- {{close}} = Current price at signal
- {{plot_1}} = Calculated take profit level
- {{plot_2}} = Calculated stop loss level
These placeholders populate automatically, creating detailed notification messages without manual configuration.
## KEY DIFFERENCE FROM ORIGINAL BOCS:
**This indicator is designed for traders seeking higher trade frequency.** The original BOCS indicator trades breakouts OUTSIDE channels, waiting for price to escape consolidation before entering. This scalper version trades mean reversion INSIDE channels, entering when price reaches channel extremes and betting on a bounce back to center. The result is significantly more trading opportunities:
- **Original BOCS**: 1-3 signals per channel (only on breakout)
- **Scalper Indicator**: 5-15+ signals per channel (every touch of entry zones)
- **Trade Style**: Mean reversion vs trend following
- **Hold Time**: Seconds to minutes vs minutes to hours
- **Best Markets**: Ranging/choppy conditions vs trending breakouts
This makes the indicator ideal for active day traders who want continuous alert opportunities within consolidation zones rather than waiting for breakout confirmation. However, increased signal frequency also means higher potential commission costs and requires disciplined trade selection when acting on alerts.
## TECHNICAL METHODOLOGY:
### Price Normalization Process:
The indicator normalizes price data to create consistent volatility measurements across different instruments and price levels. It calculates the highest high and lowest low over a user-defined lookback period (default 100 bars). Current close price is normalized using: (close - lowest_low) / (highest_high - lowest_low), producing values between 0 and 1 for standardized volatility analysis.
### Volatility Detection:
A 14-period standard deviation is applied to the normalized price series to measure price deviation from the mean. Higher standard deviation values indicate volatility expansion; lower values indicate consolidation. The indicator uses ta.highestbars() and ta.lowestbars() to identify when volatility peaks and troughs occur over the detection period (default 14 bars).
### Channel Formation Logic:
When volatility crosses from a high level to a low level (ta.crossover(upper, lower)), a consolidation phase begins. The indicator tracks the highest and lowest prices during this period, which become the channel boundaries. Minimum duration of 10+ bars is required to filter out brief volatility spikes. Channels are rendered as box objects with defined upper and lower boundaries, with colored zones indicating entry areas.
### Entry Signal Generation:
The indicator uses immediate touch-based entry logic. Entry zones are defined as a percentage from channel edges (default 20%):
- **Long Entry Zone**: Bottom 20% of channel (bottomBound + channelRange × 0.2)
- **Short Entry Zone**: Top 20% of channel (topBound - channelRange × 0.2)
Long signals trigger when candle low touches or enters the long entry zone. Short signals trigger when candle high touches or enters the short entry zone. Visual markers (arrows and labels) appear on chart, and configured alerts fire immediately.
### Cooldown Filter:
An optional cooldown period (measured in bars) prevents alert spam by enforcing minimum spacing between consecutive signals. If cooldown is set to 3 bars, no new long alert will fire until 3 bars after the previous long signal. Long and short cooldowns are tracked independently, allowing both directions to signal within the same period.
### ATR Volatility Filter:
The indicator includes a multi-timeframe ATR filter to avoid alerts during low-volatility conditions. Using request.security(), it fetches ATR values from a specified timeframe (e.g., 1-minute ATR while viewing 5-minute charts). The filter compares current ATR to a user-defined minimum threshold:
- If ATR ≥ threshold: Alerts enabled
- If ATR < threshold: No alerts fire
This prevents notifications during dead zones where mean reversion is unreliable due to insufficient price movement. The ATR status is displayed in the info table with visual confirmation (✓ or ✗).
### Take Profit Calculation:
Two TP methods are available:
**Fixed Points Mode**:
- Long TP = Entry + (TP_Ticks × syminfo.mintick)
- Short TP = Entry - (TP_Ticks × syminfo.mintick)
**Channel Percentage Mode**:
- Long TP = Entry + (ChannelRange × TP_Percent)
- Short TP = Entry - (ChannelRange × TP_Percent)
Default 50% targets the channel midline, a natural mean reversion target. These levels are displayed as visual lines with labels and included in alert messages for reference when manually placing orders.
### Stop Loss Placement:
Stop losses are calculated just outside the channel boundary by a user-defined tick offset:
- Long SL = ChannelBottom - (SL_Offset_Ticks × syminfo.mintick)
- Short SL = ChannelTop + (SL_Offset_Ticks × syminfo.mintick)
This logic assumes channel breaks invalidate the mean reversion thesis. SL levels are displayed on chart and included in alert notifications as suggested stop placement.
### Channel Breakout Management:
Channels are removed when price closes more than 10 ticks outside boundaries. This tolerance prevents premature channel deletion from minor breaks or wicks, allowing the mean reversion setup to persist through small boundary violations.
## INPUT PARAMETERS:
### Channel Settings:
- **Nested Channels**: Allow multiple overlapping channels vs single channel
- **Normalization Length**: Lookback for high/low calculation (1-500, default 100)
- **Box Detection Length**: Period for volatility detection (1-100, default 14)
### Scalping Settings:
- **Enable Long Scalps**: Toggle long alert generation on/off
- **Enable Short Scalps**: Toggle short alert generation on/off
- **Entry Zone % from Edge**: Size of entry zone (5-50%, default 20%)
- **SL Offset (Ticks)**: Distance beyond channel for stop (1+, default 5)
- **Cooldown Period (Bars)**: Minimum spacing between alerts (0 = no cooldown)
### ATR Filter:
- **Enable ATR Filter**: Toggle volatility filter on/off
- **ATR Timeframe**: Source timeframe for ATR (1, 5, 15, 60 min, etc.)
- **ATR Length**: Smoothing period (1-100, default 14)
- **Min ATR Value**: Threshold for alert enablement (0.1+, default 10.0)
### Take Profit Settings:
- **TP Method**: Choose Fixed Points or % of Channel
- **TP Fixed (Ticks)**: Static distance in ticks (1+, default 30)
- **TP % of Channel**: Dynamic target as channel percentage (10-100%, default 50%)
### Appearance:
- **Show Entry Zones**: Toggle zone labels on channels
- **Show Info Table**: Display real-time indicator status
- **Table Position**: Corner placement (Top Left/Right, Bottom Left/Right)
- **Long Color**: Customize long signal color (default: darker green for readability)
- **Short Color**: Customize short signal color (default: red)
- **TP/SL Colors**: Customize take profit and stop loss line colors
- **Line Length**: Visual length of TP/SL reference lines (5-200 bars)
## VISUAL INDICATORS:
- **Channel boxes** with semi-transparent fill showing consolidation zones
- **Colored entry zones** labeled "LONG ZONE ▲" and "SHORT ZONE ▼"
- **Entry signal arrows** below/above bars marking long/short alerts
- **TP/SL reference lines** with emoji labels (⊕ Entry, 🎯 TP, 🛑 SL)
- **Info table** showing channel status, last signal, entry/TP/SL prices, risk/reward ratio, and ATR filter status
- **Visual confirmation** when alerts fire via on-chart markers synchronized with notifications
## HOW TO USE:
### For 1-3 Minute Scalping with Alerts (NQ/ES):
- ATR Timeframe: "1" (1-minute)
- ATR Min Value: 10.0 (for NQ), adjust per instrument
- Entry Zone %: 20-25%
- TP Method: Fixed Points, 20-40 ticks
- SL Offset: 5-10 ticks
- Cooldown: 2-3 bars to reduce alert spam
- **Alert Setup**: Configure "Any Entry Signal" for combined long/short notifications
- **Execution**: When alert fires, verify chart visuals, then manually place limit order at entry zone with provided TP/SL levels
### For 5-15 Minute Day Trading with Alerts:
- ATR Timeframe: "5" or match chart
- ATR Min Value: Adjust to instrument (test 8-15 for NQ)
- Entry Zone %: 20-30%
- TP Method: % of Channel, 40-60%
- SL Offset: 5-10 ticks
- Cooldown: 3-5 bars
- **Alert Setup**: Configure separate "Long Scalp Entry" and "Short Scalp Entry" alerts if you trade directionally based on bias
- **Execution**: Review channel structure on alert, confirm ATR filter shows ✓, then enter manually
### For 30-60 Minute Swing Scalping with Alerts:
- ATR Timeframe: "15" or "30"
- ATR Min Value: Lower threshold for broader market
- Entry Zone %: 25-35%
- TP Method: % of Channel, 50-70%
- SL Offset: 10-15 ticks
- Cooldown: 5+ bars or disable
- **Alert Setup**: Use "New Channel Formation" to prepare for setups, then "Any Entry Signal" for execution alerts
- **Execution**: Larger timeframes allow more analysis time between alert and entry
### Webhook Integration for Semi-Automation:
- Configure alert webhook URL to connect with platforms like TradersPost, TradingView Paper Trading, or custom automation
- Alert message includes all necessary order parameters (direction, entry, TP, SL)
- Webhook receives structured data when signal fires
- External platform can auto-execute based on alert payload
- Still maintains manual oversight vs full strategy automation
## USAGE CONSIDERATIONS:
- **Manual Discipline Required**: Alerts provide opportunities but execution requires judgment. Not all alerts should be taken - consider market context, trend, and channel quality
- **Alert Timing**: Alerts fire on bar close by default. Ensure "Once Per Bar Close" is selected to avoid false signals during bar formation
- **Notification Delivery**: Mobile/email alerts may have 1-3 second delay. For immediate execution, use desktop popups or webhook automation
- **Cooldown Necessity**: Without cooldown, rapidly touching price action can generate excessive alerts. Start with 3-bar cooldown and adjust based on alert volume
- **ATR Filter Impact**: Enabling ATR filter dramatically reduces alert count but improves quality. Track filter status in info table to understand when you're receiving fewer alerts
- **Commission Awareness**: High alert frequency means high potential trade count. Calculate if your commission structure supports frequent scalping before acting on all alerts
## COMPATIBLE MARKETS:
Works on any instrument with price data including stock indices (NQ, ES, YM, RTY), individual stocks, forex pairs (EUR/USD, GBP/USD), cryptocurrency (BTC, ETH), and commodities. Volume-based features are not included in this indicator version. Multi-timeframe ATR requires higher-tier TradingView subscription for request.security() functionality on timeframes below chart timeframe.
## KNOWN LIMITATIONS:
- **Indicator does not execute trades** - alerts are informational only; you must manually place all orders
- **Alert delivery depends on TradingView infrastructure** - delays or failures possible during platform issues
- **No position tracking** - indicator doesn't know if you're in a trade; you must manage open positions independently
- **TP/SL levels are reference only** - you must manually set these on your broker platform; they are not live orders
- **Immediate touch entry can generate many alerts** in choppy zones without adequate cooldown
- **Channel deletion at 10-tick breaks** may be too aggressive or lenient depending on instrument tick size
- **ATR filter from lower timeframes** requires TradingView Premium/Pro+ for request.security()
- **Mean reversion logic fails** in strong breakout scenarios - alerts will fire but trades may hit stops
- **No partial closing capability** - full position management is manual; you determine scaling out
- **Alerts do not account for gaps** or overnight price changes; morning alerts may be stale
## RISK DISCLOSURE:
Trading involves substantial risk of loss. This indicator provides signals for educational and informational purposes only and does not constitute financial advice. Past performance does not guarantee future results. Mean reversion strategies can experience extended drawdowns during trending markets. Alerts are not guaranteed to be profitable and should be combined with your own analysis. Stop losses may not fill at intended levels during extreme volatility or gaps. Never trade with capital you cannot afford to lose. Consider consulting a licensed financial advisor before making trading decisions. Always verify alerts against current market conditions before executing trades manually.
## ACKNOWLEDGMENT & CREDITS:
This indicator is built upon the channel detection methodology created by **AlgoAlpha** in the "Smart Money Breakout Channels" indicator. Full credit and appreciation to AlgoAlpha for pioneering the normalized volatility approach to identifying consolidation patterns. The core channel formation logic using normalized price standard deviation is AlgoAlpha's original contribution to the TradingView community.
Enhancements to the original concept include: mean reversion entry logic (vs breakout), immediate touch-based alert generation, comprehensive alert condition system with customizable notifications, multi-timeframe ATR volatility filtering, cooldown period for alert management, dual TP methods (fixed points vs channel percentage), visual TP/SL reference lines, and real-time status monitoring table. This indicator version is specifically designed for manual traders who prefer alert-based decision making over automated execution.
Weekend Hunter Ultimate v6.2 Weekend Hunter Ultimate v6.2 - Automated Crypto Weekend Trading System
OVERVIEW:
Specialized trading strategy designed for cryptocurrency weekend markets (Saturday-Sunday) when institutional traders are typically offline and market dynamics differ significantly from weekdays. Optimized for 15-minute timeframe execution with multi-timeframe confluence analysis.
KEY FEATURES:
- Weekend-Only Trading: Automatically activates during configurable weekend hours
- Dynamic Leverage: 5-20x leverage adjusted based on market safety and signal confidence
- Multi-Timeframe Analysis: Combines 4H trend, 1H momentum, and 15M execution
- 10 Pre-configured Crypto Pairs: BTC, ETH, LINK, XRP, DOGE, SOL, AVAX, PEPE, TON, POL
- Position & Risk Management: Max 4 concurrent positions, -30% account protection
- Smart Trailing Stops: Protects profits when approaching targets
RISK MANAGEMENT:
- Maximum daily loss: 5% (configurable)
- Maximum weekend loss: 15% (configurable)
- Per-position risk: Capped at 120-156 USDT
- Emergency stops for flash crashes (8% moves)
- Consecutive loss protection (4 losses = pause)
TECHNICAL INDICATORS:
- CVD (Cumulative Volume Delta) divergence detection
- ATR-based dynamic stop loss and take profit
- RSI, MACD, Bollinger Bands confluence
- Volume surge confirmation (1.5x average)
- Weekend liquidity adjustments
INTEGRATION:
- Designed for Bybit Futures (0.075% taker fee)
- WunderTrading webhook compatibility via JSON alerts
- Minimum position size: 120 USDT (Bybit requirement)
- Initial capital: $500 recommended
TARGET METRICS:
- Win rate target: 65%
- Average win: 5.5%
- Average loss: 1.8%
- Risk-reward ratio: ~3:1
IMPORTANT DISCLAIMERS:
- Past performance does not guarantee future results
- Leveraged trading carries substantial risk of loss
- Weekend crypto markets have 13% of normal liquidity
- Not suitable for traders who cannot afford to lose their entire investment
- Requires continuous monitoring and adjustment
USAGE:
1. Apply to 15-minute charts only
2. Configure weekend hours for your timezone
3. Set up webhook alerts for automation
4. Monitor performance table in top-right corner
5. Adjust parameters based on your risk tolerance
This is an experimental strategy for educational purposes. Always test with small amounts first and never invest more than you can afford to lose completely.
Intraday Alpha Pro - ORB + Trend/MomentumOverview
This is a pure intraday trading strategy designed for active traders seeking to capitalize on short-term price movements using two complementary modules: Opening Range Breakout (ORB) and Trend/Momentum. The strategy operates strictly within a user-defined trading session, automatically flattening all positions at session end to avoid overnight carry. It employs a points-based exit system with a trailing stop that activates only after the target is reached, ensuring disciplined risk management. Optional Martingale position sizing is included for users who prefer aggressive scaling after losses.Key Features Pure Intraday, No Carry: Trades are confined to a user-defined session (default: 9:15 AM–3:25 PM, Monday–Sunday). All positions are closed at session end.
Non-Repainting: Entries are evaluated only on confirmed bar closes (barstate.isconfirmed), ensuring no lookahead or repainting.
Dual Signal Modules: Opening Range Breakout (ORB): Captures breakouts above/below the high/low of a user-defined opening range (default: 9:15 AM–9:30 AM).
Trend/Momentum: Combines EMA (9/21) crossovers, RSI filters, volume confirmation, and an optional 200-period MA trend filter for robust trend-following signals.
Points-Based Exits: Uses fixed stop-loss (slPoints, default 16 points) and take-profit (tpPoints, default 32 points) distances. Once the take-profit level is reached, a trailing stop (trailDistPts, default 10 points) activates, ratcheting monotonically to lock in gains.
Martingale Sizing (Optional): Allows position size increases after losses (up to maxQtyInput) with a reset option after wins.
Cooldown Period: Prevents immediate re-entries after exits using a configurable cooldown (cooldownBars).
Flexible Inputs: Toggle long/short entries, enable/disable ORB or Trend/Momentum modules, and customize all parameters (e.g., MA lengths, RSI thresholds, volume multiplier).
Visuals & Alerts: Plots ORB high/low lines and moving averages (9, 21, 200). Includes alerts for long/short entries and end-of-day flattening.
How It Works Session Management: Trades only within the specified tradeSes (default: 9:15 AM–3:25 PM). The ORB module uses a separate orbSes (default: 9:15 AM–9:30 AM) to calculate breakout levels. Positions are closed automatically at session end.
Entry Conditions: ORB: Long when price closes above the ORB high after the ORB session ends; short when price closes below the ORB low.
Trend/Momentum: Long on fast MA (default EMA 9) crossing above slow MA (default EMA 21), with RSI above rsiBuy (default 55), volume exceeding volMult (default 1.5x prior bar), and price above the 200-period MA (if enabled). Shorts use the inverse.
Exit Logic: Stop-loss is set at entry price ± slPoints.
Take-profit is monitored using a running high/low since entry. Once price moves tpPoints in profit, the stop trails at trailDistPts behind the current price, adjusting only in the favorable direction (never loosening).
Exits use strategy.exit with stop only (no limit orders).
Position Sizing: Default size is baseQtyInput (minimum 1 contract). With useMartingale enabled, size increases by martingaleFactor after a loss, capped at maxQtyInput. If resetOnWin is true, size resets to baseQtyInput after a winning trade.
Cooldown: After an exit, no new trades are allowed for cooldownBars to prevent overtrading.
Futures-Safe Volume: Volume filter accommodates markets with missing or zero volume data (e.g., futures), ensuring signals aren’t blocked unnecessarily.
Inputs Trading Session: tradeSes (e.g., "0915-1525:1234567") and orbSes (e.g., "0915-0930:1234567").
Toggles: enableLong, enableShort, useORB, useTrendMom, useTrendFilter (200-MA).
Trend/Momentum: maType (EMA/SMA), fastLen (9), slowLen (21), trendLen (200), rsiLen (14), rsiBuy (55), rsiSell (45), volMult (1.5).
Exits: slPoints (16), tpPoints (32), trailDistPts (10).
Martingale: useMartingale, baseQtyInput, maxQtyInput, martingaleFactor, resetOnWin.
Cooldown: cooldownBars (1).
Legacy (Ignored): tp1RR, tp2RR, tp3RR, tp1Pct, tp2Pct, tp3Pct, stepTrail for backward compatibility.
Usage Notes Best suited for liquid, intraday markets (e.g., futures like ES, NQ, or forex pairs).
Adjust slPoints, tpPoints, and trailDistPts to match instrument volatility.
Use useMartingale cautiously, as it increases risk after losses.
Ensure tradeSes and orbSes align with your market’s trading hours.
Alerts can be set for long/short entries and EOD flattening.
The strategy avoids lookahead and repainting, ensuring reliability in live trading.
Risk Warning
Trading involves significant risk. Backtest thoroughly and use appropriate risk management. The Martingale option can amplify losses if not carefully monitored. Past performance is not indicative of future results.
Power Earnings Gap Screener Pro [LevelUp]Customizable Pine Screener to scan for stocks with a Power Earnings Gap as well as accelerating earnings and sales. Historical analysis shows that strong earnings often trigger institutional buying, pushing prices higher and increasing the likelihood of sustained price gains.
🔹 Power Earnings Gap (PEG)
A power earnings gap refers to a significant price gap up after an earnings report, reflecting a rapid shift in investor sentiment and perceived value. It’s called "power" because the move is often sharp, sustained, and accompanied by high trading volume, signaling a potential trend continuation or reversal.
A gap is the difference between the closing price of a stock on the day before an earnings report and the opening price the next trading day. A power earnings gap typically exceeds a certain threshold (e.g., 8-10% or more) and is driven by earnings surprises, guidance changes, or other significant news.
Strong earnings beats, misses, or forward-looking guidance can trigger these gaps. For example, a company reporting higher-than-expected profits or raising guidance might gap up, while a miss or weak outlook could cause a gap down.
The gap is often accompanied by above-average trading volume, confirming the move's strength. Power gaps often lead to sustained price movement in the direction of the gap (continuation) or signal a reversal if the gap fills quickly.
How Power Earnings Gap Be Helpful
▪ Power earnings gaps often indicate strong momentum. Traders can capitalize on this by entering trades in the direction of the gap (e.g., buying on a gap-up if the trend continues).
Example: If a stock gaps up 10% after a stellar earnings report and shows high volume, traders might buy, expecting further upside as momentum builds.
▪ Breakout Opportunities: A gap through key technical levels (e.g., resistance or support) can signal a breakout. Traders use these gaps to identify potential long-term trends.
Example: A stock breaking above a resistance level on a power earnings gap may continue to rally, offering a setup for swing or position traders.
▪ Volatility for Short-Term Trades: Earnings gaps create heightened volatility, ideal for day traders or scalpers. The large price swings allow for quick profits if timed correctly.
Example: A trader might use options (e.g., calls for a gap-up, puts for a gap-down) to leverage the volatility around earnings.
▪ Confirmation of Fundamental Strength/Weakness: A power earning gap often reflects a fundamental shift, e.g., strong earnings growth or a major business development. Traders can use this to align technical setups with fundamental catalysts.
Example: A gap-up after a company raises its full-year guidance might signal a long-term buying opportunity.
▪ Risk Management and Stop Losses: Gaps provide clear levels for setting stop-loss orders. For instance, traders might place stops at or below the gap up bar low to protect against a potential reversal.
Example: If a stock gaps up from $100 to $110 and intraday hits a low of $105, a trader might set a stop at $105 or lower to limit downside risk.
▪ Gap Fill Strategies:Some traders bet on gaps filling, i.e., the stock returning to its pre-gap price. If a power earnings gap seems overextended (e.g., due to market overreaction), contrarian traders might short a gap-up or buy a gap-down, anticipating a pullback.
Example: A stock gaps up 15% but lacks volume or follow-through; a trader might short it, expecting the price to retreat.
🔹 Earnings and Sales Acceleration
Earnings and sales acceleration refers to the rate of growth in a company's earnings over consecutive quarters. It highlights companies that are not only growing but doing so at an accelerating pace, signaling improving financial health and operational momentum. This metric is derived from earnings reports, which detail a company’s financial performance.
Key Concepts
▪ Earnings Acceleration: When a company’s earnings per share (EPS) growth rate increases over time (e.g., EPS growth of 10% in Q1, 15% in Q2, 20% in Q3). It indicates improving profitability, often due to cost efficiencies, margin expansion and strong demand.
▪ Sales Acceleration: When revenue growth rates increase over time (e.g., revenue growth of 5% in Q1, 8% in Q2, 12% in Q3). This reflects rising demand for products/services and operational efficiency.
▪ Relation to Earnings Reports: Acceleration is calculated by comparing sequential quarter-over-year growth rates in earnings and sales, often highlighted in earnings reports or analyst commentary. It’s a sign of fundamental strength when both metrics accelerate together.
How It’s Helpful to Traders
▪ Identify High-Potential Stocks: Stocks with accelerating earnings and sales often attract investor attention, as they signal a company is outperforming expectations and gaining market share. This can lead to sustained price appreciation.
Example: A tech company reporting 20% EPS growth and 15% sales growth quarter-over-quarter may see bullish price action as investors bet on continued momentum.
▪ Momentum Trading Opportunities: Acceleration often fuels stock price momentum, especially post-earnings. Traders can ride these trends using technical setups like breakouts or pullbacks.
Example: A stock breaking above a key resistance level after reporting accelerating growth may be a buy signal for swing traders.
▪ Early Indicator of Breakouts: Companies with accelerating fundamentals are more likely to experience price breakouts, as institutional investors (e.g., hedge funds, mutual funds) pile in. Traders can use this to position early.
Example: A retailer with accelerating sales due to strong holiday demand might gap up post-earnings, offering a breakout trade.
▪ Confirmation of Fundamental Strength: Acceleration validates a company’s growth story, reducing the risk of investing in stocks with inconsistent performance. Traders can align technical trades with strong fundamentals.
Example: A biotech with accelerating sales from a new drug launch may sustain a rally, giving traders confidence in long positions.
▪ Volatility for Short-Term Trades: Earnings reports showing acceleration often lead to significant price gaps or volatility, creating opportunities for day traders or options traders.
Example: A trader might buy call options on a stock expected to report accelerating earnings, anticipating a sharp post-earnings move.
🔹 Power Earnings Gaps - Examples
🔹 Screening Features - Setting Your Search Criteria
Power Earnings Gap
▪ Search Range
How many bars back to search for Power Earnings Gaps, anywhere between 1 and 90 bars.
▪ Last Bar Only
Look only at the last bar for Power Earnings Gaps. This is useful when looking for PEGs when screening at the end of a trading day. Choosing this option, the Search Range will be ignored.
▪ Minimum Price % Gap Up From Prior Close
This is the minimum gap up percent change to be considered a Power Earnings Gap.
▪ Minimum Volume % Change Over Average
This is the minimum volume percent change, over the 50-day average volume, to be considered a Power Earnings Gap.
▪ Require Positive Surprise
Require a positive earnings surprise and the minimum percent change.
▪ Require Closing Range
To ensure the price action closed strong on the day, specify a preferred closing range as a percentage of the bar's daily range.
▪ Gap Up Bar
The gap up bar can be configured to require one of the following:
- Open Above Prior High - Ensures there is visible gap up from the prior bar.
- Low Above Prior High - Allows for intraday price action to go below the prior bar high.
- No Requirement
Earnings And Sales Acceleration
▪ Quarters of Acceleration
You can specify between 1 and 4 quarters of earnings and/or sales acceleration.
🔹 Installation And Usage
▪ Mark this indicator as a Favorite.
▪ Use the Pine Screener to search for stocks.
▪ Save the search results to a watchlist.
▪ View the watchlist in TradingView.
🔹 Note
▪ Risk of Reversals: Not all gaps sustain their direction. Over reactions can lead to gap fills.
▪ High Volatility: Earnings gaps can be unpredictable, requiring quick decision-making & discipline.
Paid script
Rachas ATR AssistHey Traders!
This indicator is a simple, it uses Average True Range (ATR) data from the daily chart and the current timeframe to estimate potential range and volatility.
This indicator compares the daily ATR to the current daily wick range (from low to high), helping you gauge how much "room" might be left for price movement within the day. Alongside that, it shows the ATR over the last 14 candles and 5 candles on your current chart for intraday volatility awareness—ideal for setting stops, targets, or position sizing.
Gauge Daily Potential Movement:
The "Day Range Difference" cell shows how much of the expected daily range (based on ATR) is still unfilled. If the market has moved less than the average, there's still potential for expansion. If it's close to or above the ATR, expect a slowdown or reversal.
Position Sizing & Stop Losses:
Use the 14-period ATR and 5-period ATR on your current timeframe to understand recent volatility. This helps in choosing logical stop loss levels and adjusting position sizes based on market conditions.
Volatility Awareness:
Knowing the average daily range and how much of it has been used lets you avoid entering trades too late in the move or placing stops in overly tight spots.
Table Position & Font:
You can adjust the table location (top/bottom left/right) and font size to best fit your chart layout.
Volatility Layered Supertrend [NLR]We’ve all used Supertrend, but do you know where to actually enter a trade? Volatility Layered Supertrend (VLS) is here to solve that! This advanced trend-following indicator builds on the classic Supertrend by not only identifying trends and their strength but also guiding you to the best trade entry points. VLS divides the main long-term trend into “Strong” and “Weak” Zones, with a clear “Trade Entry Zone” to help you time your trades with precision. With layered trends, dynamic profit targets, and volatility-adaptive bands, VLS delivers actionable signals for any market.
Why I Created VLS Over a Plain Supertrend
I built VLS to address the gaps in traditional Supertrend usage and make trade entries clearer:
Single-Line Supertrend Issues: The default Supertrend sets stop-loss levels that are too wide, making it impractical for most traders to use effectively.
Unclear Entry Points: Standard Supertrend doesn’t tell you where to enter a trade, often leaving you guessing or entering too early or late.
Multi-Line Supertrend Enhancement: Many traders use short, medium, and long Supertrends, which is helpful but can lack focus. In VLS, I include Short, Medium, and Long trends (using multipliers 1 to 3), and add multipliers 4 and 5 to track extra long-term trends—helping to avoid fakeouts that sometimes occur with multiplier 3.
My Solution: I focused on the main long-term Supertrend and split it into “Weak Zone” and “Strength Zone” to show the trend’s reliability. I also defined a “Trade Entry Zone” (starting from the Mid Point, with the first layer’s background hidden for clarity) to guide you on where to enter trades. The zones include Short, Medium, and Long Trend layers for precise entries, exits, and stop-losses.
Practical Trading: This approach provides realistic stop-loss levels, clear entry points, and a “Profit Target” line that aligns with your risk tolerance, while filtering out false signals with longer-term trends.
Key Features
Layered Trend Zones: Short, Medium, Long, and Extra Long Trend layers (up to multipliers 4 and 5) for timing entries and exits.
Strong & Weak Zones: See when the trend is reliable (Strength Zone) or needs caution (Weak Zone).
Trade Entry Zone: A dedicated zone starting from the Mid Point (first layer’s background hidden) to show the best entry points.
Dynamic Profit Targets: A “Profit Target” line that adjusts with the trend for clear goals.
Volatility-Adaptive: Uses ATR to adapt to market conditions, ensuring reliable signals.
Color-Coded: Green for uptrends, red for downtrends—simple and clear.
How It Works
VLS enhances the main long-term Supertrend by dividing it into two zones:
Weak Zone: Indicates a less reliable trend—use tighter stop-losses or wait for the price to reach the Trade Entry Zone.
Strength Zone: Signals a strong trend—ideal for entries with wider stop-losses for bigger moves.
The “Trade Entry Zone” starts at the Mid Point (last layer’s background hidden for clarity), showing you the best area to enter trades. Each zone includes Short, Medium, Long, and Extra Long Trend sublevels (up to multipliers 4 and 5) for precise trade timing and to filter out fakeouts. The “Profit Target” updates dynamically based on trend direction and volatility, giving you a clear goal.
How to Use
Spot the Trend: Green bands = buy, red bands = sell.
Check Strength: Price in Strength Zone? Trend’s reliable—trade confidently. In Weak Zone? Use tighter stops or wait.
Enter Trades: Use the “Trade Entry Zone” (from the Mid Point upward) for the best entry points.
Use Sublevels: Short, Medium, Long, and Extra Long layers in each zone help fine-tune entries and exits.
Set Targets: Follow the Profit Target line for goals—it updates automatically.
Combine Tools: Pair with RSI, MACD, or support/resistance for added confirmation.
Settings
ATR Length: Adjust the ATR period (default 10) to change sensitivity.
Up/Down Colors: Customize colors—green for up, red for down, by default.
Long Term Profitable Swing | AbbasA Story of a Profitable Swing Trading Strategy
Imagine you're sailing across the ocean, looking for the perfect wave to ride. Swing trading is quite similar—you're navigating the stock market, searching for the ideal moments to enter and exit trades. This strategy, created by Abbas, helps you find those waves and ride them effectively to profitable outcomes.
🌊 Finding the Perfect Wave (Entry)
Our journey begins with two simple signs that tell us a great trading opportunity is forming:
- Moving Averages: We use two lines that follow price trends—the faster one (EMA 16) reacts quickly to recent price moves, and the slower one (EMA 30) gives us a longer-term perspective. When the faster line crosses above the slower line, it's like a clear signal saying, "Hey! The wave is rising, and prices might move higher!"
- RSI Momentum: Next, we check a tool called the RSI, which measures momentum (how strongly prices are moving). If the RSI number is above 50, it means there's enough strength behind this rising wave to carry us forward.
When both signals appear together, that's our green light. It's time to jump on our surfboard and start riding this promising wave.
⚓ Safely Riding the Wave (Risk Management)
While we're riding this wave, we want to ensure we're safe from sudden surprises. To do this, we use something called the Average True Range (ATR), which measures how volatile (or bumpy) the price movements are:
- Stop-Loss: To avoid falling too hard, we set a safety line (stop-loss) 8 times the ATR below our entry price. This helps ensure we exit if the wave suddenly turns against us, protecting us from heavy losses.
- Take Profit: We also set a goal to exit the trade at 11 times the ATR above our entry. This way, we capture significant profits when the wave reaches a nice high point.
🌟 Multiple Rides, Bigger Adventures
This strategy allows us to take multiple positions simultaneously—like riding several waves at once, up to 5. Each trade we make uses only 10% of our trading capital, keeping risks manageable and giving us multiple opportunities to win big.
🗺️ Easy to Follow Settings
Here are the basic settings we use:
- Fast EMA**: 16
- Slow EMA**: 30
- RSI Length**: 9
- RSI Threshold**: 50
- ATR Length**: 21
- ATR Stop-Loss Multiplier**: 8
- ATR Take-Profit Multiplier**: 11
These settings are flexible—you can adjust them to better suit different markets or your personal trading style.
🎉 Riding the Waves of Success
This simple yet powerful swing trading approach helps you confidently enter trades, clearly know when to exit, and effectively manage your risk. It’s a reliable way to ride market waves, capture profits, and minimize losses.
Happy trading, and may you find many profitable waves to ride! 🌊✨
Please test, and take into account that it depends on taking multiple longs within the swing, and you only get to invest 25/30% of your equity.
Heiken Ashi Supertrend ATR-SL StrategyThis indicator combines Heikin Ashi candle pattern analysis with Supertrend to generate high-probability trading signals with built-in risk management. It identifies potential entries and exits based on specific Heikin Ashi candlestick formations while providing automated ATR-based stop loss management.
Trading Logic:
The system generates long signals when a green Heikin Ashi candle forms with no bottom wick (indicating strong bullish momentum). Short signals appear when a red Heikin Ashi candle forms with no top wick (showing strong bearish momentum). The absence of wicks on these candles signals a high-conviction market move in the respective direction.
Exit signals are triggered when:
1. An opposite pattern forms (red candle with no top wick exits longs; green candle with no bottom wick exits shorts)
2. The ATR-based stop loss is hit
3. The break-even stop is activated and then hit
Technical Approach:
- Select Heiken Ashi Canldes on your Trading View chart. Entried are based on HA prices.
- Supertrend and ATR-based stop losses use real price data (not HA values) for trend determination
- ATR-based stop losses automatically adjust to market volatility
- Break-even functionality moves the stop to entry price once price moves a specified ATR multiple in your favor
Risk Management:
- Default starting capital: 1000 units
- Default risk per trade: 10% of equity (customizable in strategy settings)
- Hard Stop Loss: Set ATR multiplier (default: 2.0) for automatic stop placement
- Break Even: Configure ATR threshold (default: 1.0) to activate break-even stops
- Appropriate position sizing relative to equity and stop distance
Customization Options:
- Supertrend Settings:
- Enable/disable Supertrend filtering (trade only in confirmed trend direction)
- Adjust Factor (default: 3.0) to change sensitivity
- Modify ATR Period (default: 10) to adapt to different timeframes
Visual Elements:
- Green triangles for long entries, blue triangles for short entries
- X-marks for exits and stop loss hits
- Color-coded position background (green for long, blue for short)
- Clearly visible stop loss lines (red for hard stop, white for break-even)
- Comprehensive position information label with entry price and stop details
Implementation Notes:
The indicator tracks positions internally and maintains state across bars to properly manage stop levels. All calculations use confirmed bars only, with no repainting or lookahead bias. The system is designed for swing trading on timeframes from 1-hour and above, where Heikin Ashi patterns tend to be more reliable.
This indicator is best suited for traders looking to combine the pattern recognition strengths of Heikin Ashi candles with the trend-following capabilities of Supertrend, all while maintaining disciplined risk management through automated stops.


